引言
我们这一篇主要是关注在我们 Prometheus-Operator 相关 Grafana YAML 文件。因为我这边不打算使用 Helm 安装,所以,你懂。
我们还需要搞清楚资源的处理: 哪些需要,哪些不需要;哪些需要优化,哪些不需要优化;哪些需要监控,哪些不需要监控。 这些我们搞清楚之后,往后面进行就会比较清晰了。
开始
需要监控的部分
应用层监控
应用性能指标:
• 响应时间:监控API响应时间,确保服务的及时性。
• 吞吐量:请求数、事务数等,评估应用的处理能力。
• 错误率:监控HTTP错误码(如4xx、5xx)及应用内部错误。
业务指标:
• 根据具体业务需求,监控关键业务指标(如用户注册数、订单量等)。
• 日志监控:
a.收集和分析应用日志,及时发现和排查问题。
资源使用情况
CPU 和内存使用率:
• 监控应用实例的CPU和内存使用,避免资源瓶颈。
网络流量:
• 监控入站和出站流量,确保网络资源充足。
存储使用:
• 如果应用使用了存储资源,监控存储的使用情况和性能。
函数调用监控(Serverless 特有)
• 函数执行次数:监控函数的调用频率,了解负载情况。
• 函数执行时长:确保函数执行时间在预期范围内。
• 错误率:监控函数执行失败的比例,及时发现问题。
安全监控
• 访问控制:监控异常访问行为,防范潜在的安全威胁。
• 漏洞扫描:定期扫描应用和依赖库的安全漏洞。
不需要监控的部分
由于阿里云负责维护基础设施和部分组件,以下部分通常不需要自行监控:
基础设施健康状况:
• 如底层服务器、网络设备、存储设备的健康状态,这些由阿里云负责监控和维护。
Kubernetes 控制平面:
• 如 API 服务器、调度器、控制器管理器等组件的运行状况,阿里云会确保其高可用性和稳定性。
基础组件的日志和指标:
• 如etcd、kubelet等组件的日志和性能指标,这些通常由阿里云自动处理。
监控设计的最佳实践
定义关键指标(KPIs):
• 明确哪些指标对业务和应用性能至关重要,优先监控这些指标。
设置告警策略:
• 根据关键指标设置合理的阈值和告警策略,确保问题能及时被发现和处理。
可视化仪表盘:
• 创建直观的仪表盘,实时展示关键指标,便于监控和分析。
定期审查和优化:
• 定期回顾监控数据和策略,根据业务变化和应用需求进行优化。
在使用阿里云 ACK Serverless 集群时,监控重点应放在应用性能、业务指标、资源使用情况以及安全方面。利用阿里云提供的监控工具和服务,可以有效地实现全面的监控,同时减轻运维负担。通过合理的监控设计,可以确保应用的稳定性和性能,及时响应潜在的问题。
Prometheus-Operator Manifests
我们这边使用的是最新版本的,重点主要两部分:

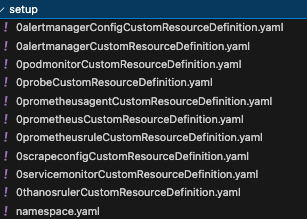
CRDs
 图片
图片
这些就是 Prometheus-Operator 会使用的 CRD。
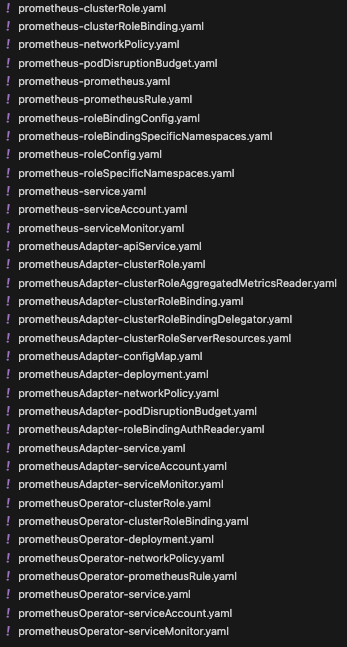
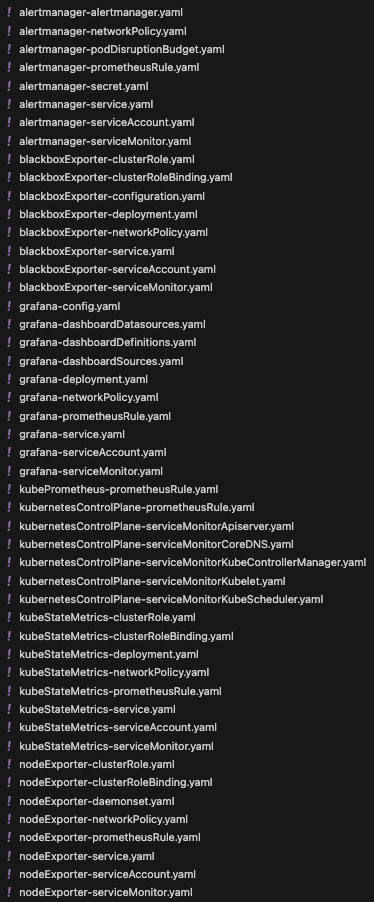
API Resources
 图片
图片
 图片
图片
以上就是我们 Prometheus-Operator 将要使用的所有的 YAML 文件,我们可以分为两个部分:
API Resources:
• RBAC
• NetworkPolicy
• Service
• ConfigMap
• Secret
• ServiceAccount
• PodDistruptionBudget
• 相关控制器 文件
CRDs:
• ServiceMonitor
• PrometheusRule
• AlertManager
• Prometheus
重点在于 Grafana 和 Prometheus,我们这篇先 Grafana。
Grafana
我们前面的概念讲解了我们要监控的东西,和不要监控的东西,所以,我们这里就直接把不需要的 Dashboard 直接给去掉了,因为集群是自托管的,所以,关于控制平面还有我们工作节点相关的监控就不需要了。
Prometheus-Operator 里面默认有很多:
• Alertmanager-overview
• APIserver
• Cluster-total
• Controller-manager
• Grafana-overview
• k8s-resources-custer
• k8s-resources-multicluster
• k8s-resources-namespace
• k8s-resources-node
• k8s-resources-pod
• k8s-resources-workload
• k8s-resources-workload-namespace
• Kubelet
• Namespace-by-pod
• Namespace-by-workload
• Node-cluster-rsrc-use
• Node-rsrc-use
• Node-aix
• Nodes-drawin
• Nodes
• Persistentvolumesusage
• Pod-total
• Prometheus-remote-write
• Prometheus
• Proxy
• Scheduler
• Workload-total
对于 ACK Serverless 集群,由于其无节点 (Node-less) 和 弹性架构的特点,很多与传统 Kubernetes 物理节点相关的 Dashboard 可能没有实际意义。
以下是列出的 Dashboard 的分类和建议:
推荐保留的 Dashboard
这些 Dashboard 与 Serverless 集群或核心服务的监控相关,建议保留:
Alertmanager-overview
• 显示 Alertmanager 的状态和告警相关信息。
• 如果监控系统中使用了 Alertmanager,保留该 Dashboard。
Cluster-total
• 监控整个集群的总体资源使用情况和 Pod 状态。
• 对于 Serverless 集群,关注 Pods 和整体负载是有意义的。
Grafana-overview
• 监控 Grafana 本身的性能和数据源状态。
• 适合用于查看 Grafana 的健康状况。
k8s-resources-namespace
• 监控不同命名空间的资源使用情况(如 CPU、内存、Pod 数量)。
• 在 Serverless 集群中,命名空间仍然是资源隔离的主要手段,因此保留。
k8s-resources-pod
• 查看每个 Pod 的资源使用情况。
• Serverless 集群中仍需关注 Pod 的状态和资源消耗。
k8s-resources-workload
• 监控工作负载(如 Deployment、StatefulSet)的运行状况。
• Serverless 集群中工作负载是重点,建议保留。
k8s-resources-workload-namespace
• 按命名空间查看工作负载资源的运行情况。
• 如果有多个命名空间隔离的应用,可以保留。
Namespace-by-pod
• 按命名空间查看 Pod 的状态和资源。
• 与 k8s-resources-pod 类似,适合用于按命名空间细化监控。
Namespace-by-workload
• 按命名空间查看工作负载的运行状况。
• 与 k8s-resources-workload-namespace 类似,建议保留。
Prometheus-remote-write
• 如果使用 Prometheus 的远程写入(比如 GreptimeDB,我们后面会用到)功能,该 Dashboard 用于查看远程写入状态和性能。
Workload-total
• 查看所有工作负载的总资源使用情况。
• Serverless 集群中关注工作负载总量和整体消耗,建议保留。
Prometheus
• 监控 Prometheus 的自身状态(如查询性能、存储使用)。
• 如果使用 Prometheus 作为监控后端,建议保留。
不建议保留的 Dashboard
这些 Dashboard 与物理节点(Node)相关或在 Serverless 架构中不适用,建议删除:
k8s-resources-node
• 显示每个节点的资源使用情况。
• Serverless 集群没有物理节点,因此没有意义。
Node-cluster-rsrc-use
• 监控节点在集群中的资源使用情况。
• 同上,Serverless 集群没有物理节点,建议删除。
Node-rsrc-use
• 监控单个节点的资源消耗。
• 同上,无物理节点时无意义。
Node-aix
• 监控运行 AIX 系统的节点。
• 在 Kubernetes 中通常较少使用,Serverless 集群中无意义。
Nodes-drawin
• 监控运行 Darwin(macOS)系统的节点。
• Serverless 集群中不会使用 macOS 作为节点,无意义。
Nodes
• 查看所有节点的状态和资源使用。
• Serverless 集群没有节点相关的概念,建议删除。
Persistentvolumesusage
• 查看持久化卷的使用情况。
• Serverless 集群中通常不会直接使用持久化卷(如 PVC),而是使用外部存储服务(如 NAS、OSS),因此可以删除。
Pod-total
• 聚焦于所有 Pod 的状态和资源。
• 如果已经保留了 Cluster-total 和 k8s-resources-pod,可以删除该 Dashboard。
Proxy
• 显示 Kubernetes 中 kube-proxy 的状态。
• Serverless 集群中通常不涉及 kube-proxy,因此可以删除。
Kubelet
• 监控每个节点上的 kubelet 状态。
• Serverless 集群中没有实际的 kubelet,因此可以删除。
Scheduler
• 监控 Kubernetes 调度器的性能和任务分配情况。
• 可以删除,用不到
部分视需求保留的 Dashboard
这些 Dashboard 可能根据具体需求决定是否保留:
Controller-manager
• 用于监控 Kubernetes 控制器管理器的状态。
• Serverless 集群中控制器管理器依然存在,但其重要性可能不高。如果对控制器管理器的性能和状态无特殊关注,可删除。
k8s-resources-cluster
• 查看整个集群的资源使用情况。
• 如果已经保留了 Cluster-total,可以删除此 Dashboard。
k8s-resources-multicluster
• 监控多个集群的资源使用。
• 如果没有跨集群的需求或 Serverless 集群是单一集群,则可以删除。
Pod-total
• 如果已经保留了 Workload-total 和 k8s-resources-pod,此 Dashboard 可以删除。
最终整理
保留的 Dashboard
• Alertmanager-overview
• Cluster-total
• Grafana-overview
• k8s-resources-namespace
• k8s-resources-pod
• k8s-resources-workload
• k8s-resources-workload-namespace
• Namespace-by-pod
• Namespace-by-workload
• Prometheus-remote-write
• Workload-total
• Prometheus
删除的 Dashboard
• k8s-resources-node
• APIserver
• Node-cluster-rsrc-use
• Node-rsrc-use
• Node-aix
• Nodes-drawin
• Nodes
• Persistentvolumesusage
• Proxy
• Kubelet
• Scheduler
可选视需求保留
• Controller-manager
• k8s-resources-cluster
• k8s-resources-multicluster
• Pod-total
然后,这边需要优化或者删掉一些 Dashboard,这里面有很多都用不到,但是在这之前,我们需要熟悉下 Dashboard 的 JSON 格式的配置,这边随便找一个吧,因为这个也是挺重要的,后面我们还会涉及到修改 Dashboard 的 JSON 配置。
Grafana Dashboard JSON 解析
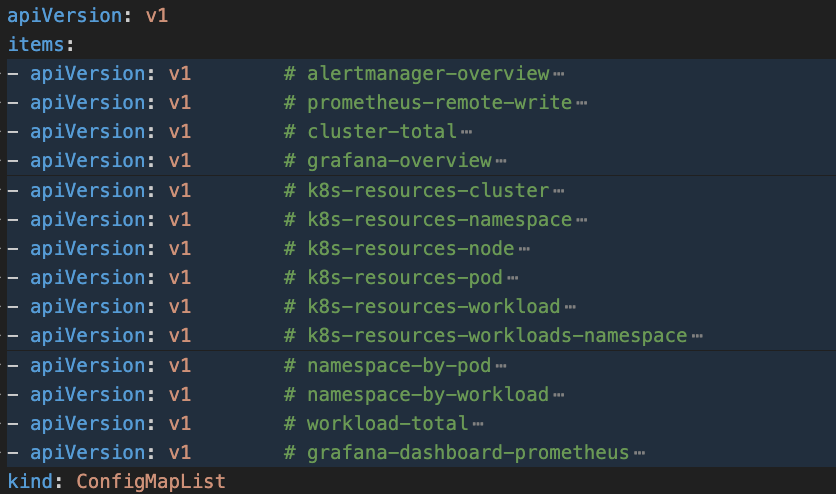
这个就是定义 Grafana Dashboard 的 Config 文件,这里因为我把它折叠了,这样就比较简洁了,不然几万行……
可以看到类型是 ConfigMapList,解释下吧: ConfigMapList 是一个包含多个 ConfigMap 对象的列表。它通常在需要一次性查看或操作多个 ConfigMap 的场景下使用,比如通过 kubectl 查询所有 ConfigMap 时,Kubernetes API 会返回一个 ConfigMapList 对象。
注意:如果你使用 kubectl get confgmaplist -A,是不会有结果的,因为 ConfigMapList 仅用作数据查询返回和临时存储,不会直接定义和应用到 Kubernetes 集群中。
 图片
图片
为了方便我们后续的进行,我们必须要熟悉 Grafana Dashboard 的 JSON 文件,因为后续需要修改和改进,这边随便找一个吧,非常多,大家谨慎观看 😂 ,没事,后面有解析:
{
"graphTooltip": 1,
"panels": [
{
"collapsed": false,
"gridPos": {
"h": 1,
"w": 24,
"x": 0,
"y": 0
},
"id": 1,
"panels": [
],
"title": "CPU",
"type": "row"
},
{
"datasource": {
"type": "prometheus",
"uid": "${datasource}"
},
"fieldConfig": {
"defaults": {
"custom": {
"fillOpacity": 100,
"showPoints": "never",
"stacking": {
"mode": "normal"
}
},
"unit": "percentunit"
}
},
"gridPos": {
"h": 7,
"w": 12,
"x": 0,
"y": 1
},
"id": 2,
"options": {
"legend": {
"showLegend": false
},
"tooltip": {
"mode": "multi",
"sort": "desc"
}
},
"pluginVersion": "v11.4.0",
"targets": [
{
"datasource": {
"type": "prometheus",
"uid": "$datasource"
},
"expr": "instance:node_cpu_utilisation:rate5m{job=\"node-exporter\", instance=\"$instance\", cluster=\"$cluster\"} != 0",
"legendFormat": "Utilisation"
}
],
"title": "CPU Utilisation",
"type": "timeseries"
},
{
"datasource": {
"type": "prometheus",
"uid": "${datasource}"
},
"fieldConfig": {
"defaults": {
"custom": {
"fillOpacity": 100,
"showPoints": "never",
"stacking": {
"mode": "normal"
}
},
"unit": "percentunit"
}
},
"gridPos": {
"h": 7,
"w": 12,
"x": 12,
"y": 1
},
"id": 3,
"options": {
"legend": {
"showLegend": false
},
"tooltip": {
"mode": "multi",
"sort": "desc"
}
},
"pluginVersion": "v11.4.0",
"targets": [
{
"datasource": {
"type": "prometheus",
"uid": "$datasource"
},
"expr": "instance:node_load1_per_cpu:ratio{job=\"node-exporter\", instance=\"$instance\", cluster=\"$cluster\"} != 0",
"legendFormat": "Saturation"
}
],
"title": "CPU Saturation (Load1 per CPU)",
"type": "timeseries"
},
{
"collapsed": false,
"gridPos": {
"h": 1,
"w": 24,
"x": 0,
"y": 8
},
"id": 4,
"panels": [
],
"title": "Memory",
"type": "row"
},
{
"datasource": {
"type": "prometheus",
"uid": "${datasource}"
},
"fieldConfig": {
"defaults": {
"custom": {
"fillOpacity": 100,
"showPoints": "never",
"stacking": {
"mode": "normal"
}
},
"unit": "percentunit"
}
},
"gridPos": {
"h": 7,
"w": 12,
"x": 0,
"y": 9
},
"id": 5,
"options": {
"legend": {
"showLegend": false
},
"tooltip": {
"mode": "multi",
"sort": "desc"
}
},
"pluginVersion": "v11.4.0",
"targets": [
{
"datasource": {
"type": "prometheus",
"uid": "$datasource"
},
"expr": "instance:node_memory_utilisation:ratio{job=\"node-exporter\", instance=\"$instance\", cluster=\"$cluster\"} != 0",
"legendFormat": "Utilisation"
}
],
"title": "Memory Utilisation",
"type": "timeseries"
},
{
"datasource": {
"type": "prometheus",
"uid": "${datasource}"
},
"fieldConfig": {
"defaults": {
"custom": {
"fillOpacity": 100,
"showPoints": "never",
"stacking": {
"mode": "normal"
}
},
"unit": "rds"
}
},
"gridPos": {
"h": 7,
"w": 12,
"x": 12,
"y": 9
},
"id": 6,
"options": {
"legend": {
"showLegend": false
},
"tooltip": {
"mode": "multi",
"sort": "desc"
}
},
"pluginVersion": "v11.4.0",
"targets": [
{
"datasource": {
"type": "prometheus",
"uid": "$datasource"
},
"expr": "instance:node_vmstat_pgmajfault:rate5m{job=\"node-exporter\", instance=\"$instance\", cluster=\"$cluster\"} != 0",
"legendFormat": "Major page Faults"
}
],
"title": "Memory Saturation (Major Page Faults)",
"type": "timeseries"
},
{
"collapsed": false,
"gridPos": {
"h": 1,
"w": 24,
"x": 0,
"y": 16
},
"id": 7,
"panels": [
],
"title": "Network",
"type": "row"
},
{
"datasource": {
"type": "prometheus",
"uid": "${datasource}"
},
"fieldConfig": {
"defaults": {
"custom": {
"fillOpacity": 100,
"showPoints": "never",
"stacking": {
"mode": "normal"
}
},
"unit": "Bps"
},
"overrides": [
{
"matcher": {
"id": "byRegexp",
"options": "/Transmit/"
},
"properties": [
{
"id": "custom.transform",
"value": "negative-Y"
}
]
}
]
},
"gridPos": {
"h": 7,
"w": 12,
"x": 0,
"y": 17
},
"id": 8,
"options": {
"legend": {
"showLegend": false
},
"tooltip": {
"mode": "multi",
"sort": "desc"
}
},
"pluginVersion": "v11.4.0",
"targets": [
{
"datasource": {
"type": "prometheus",
"uid": "$datasource"
},
"expr": "instance:node_network_receive_bytes_excluding_lo:rate5m{job=\"node-exporter\", instance=\"$instance\", cluster=\"$cluster\"} != 0",
"legendFormat": "Receive"
},
{
"datasource": {
"type": "prometheus",
"uid": "$datasource"
},
"expr": "instance:node_network_transmit_bytes_excluding_lo:rate5m{job=\"node-exporter\", instance=\"$instance\", cluster=\"$cluster\"} != 0",
"legendFormat": "Transmit"
}
],
"title": "Network Utilisation (Bytes Receive/Transmit)",
"type": "timeseries"
},
{
"datasource": {
"type": "prometheus",
"uid": "${datasource}"
},
"fieldConfig": {
"defaults": {
"custom": {
"fillOpacity": 100,
"showPoints": "never",
"stacking": {
"mode": "normal"
}
},
"unit": "Bps"
},
"overrides": [
{
"matcher": {
"id": "byRegexp",
"options": "/Transmit/"
},
"properties": [
{
"id": "custom.transform",
"value": "negative-Y"
}
]
}
]
},
"gridPos": {
"h": 7,
"w": 12,
"x": 12,
"y": 17
},
"id": 9,
"options": {
"legend": {
"showLegend": false
},
"tooltip": {
"mode": "multi",
"sort": "desc"
}
},
"pluginVersion": "v11.4.0",
"targets": [
{
"datasource": {
"type": "prometheus",
"uid": "$datasource"
},
"expr": "instance:node_network_receive_drop_excluding_lo:rate5m{job=\"node-exporter\", instance=\"$instance\", cluster=\"$cluster\"} != 0",
"legendFormat": "Receive"
},
{
"datasource": {
"type": "prometheus",
"uid": "$datasource"
},
"expr": "instance:node_network_transmit_drop_excluding_lo:rate5m{job=\"node-exporter\", instance=\"$instance\", cluster=\"$cluster\"} != 0",
"legendFormat": "Transmit"
}
],
"title": "Network Saturation (Drops Receive/Transmit)",
"type": "timeseries"
},
{
"collapsed": false,
"gridPos": {
"h": 1,
"w": 24,
"x": 0,
"y": 24
},
"id": 10,
"panels": [
],
"title": "Disk IO",
"type": "row"
},
{
"datasource": {
"type": "prometheus",
"uid": "${datasource}"
},
"fieldConfig": {
"defaults": {
"custom": {
"fillOpacity": 100,
"showPoints": "never",
"stacking": {
"mode": "normal"
}
},
"unit": "percentunit"
}
},
"gridPos": {
"h": 7,
"w": 12,
"x": 0,
"y": 25
},
"id": 11,
"options": {
"legend": {
"showLegend": false
},
"tooltip": {
"mode": "multi",
"sort": "desc"
}
},
"pluginVersion": "v11.4.0",
"targets": [
{
"datasource": {
"type": "prometheus",
"uid": "$datasource"
},
"expr": "instance_device:node_disk_io_time_seconds:rate5m{job=\"node-exporter\", instance=\"$instance\", cluster=\"$cluster\"} != 0",
"legendFormat": "{{device}}"
}
],
"title": "Disk IO Utilisation",
"type": "timeseries"
},
{
"datasource": {
"type": "prometheus",
"uid": "${datasource}"
},
"fieldConfig": {
"defaults": {
"custom": {
"fillOpacity": 100,
"showPoints": "never",
"stacking": {
"mode": "normal"
}
},
"unit": "percentunit"
}
},
"gridPos": {
"h": 7,
"w": 12,
"x": 12,
"y": 25
},
"id": 12,
"options": {
"legend": {
"showLegend": false
},
"tooltip": {
"mode": "multi",
"sort": "desc"
}
},
"pluginVersion": "v11.4.0",
"targets": [
{
"datasource": {
"type": "prometheus",
"uid": "$datasource"
},
"expr": "instance_device:node_disk_io_time_weighted_seconds:rate5m{job=\"node-exporter\", instance=\"$instance\", cluster=\"$cluster\"} != 0",
"legendFormat": "{{device}}"
}
],
"title": "Disk IO Saturation",
"type": "timeseries"
},
{
"collapsed": false,
"gridPos": {
"h": 1,
"w": 24,
"x": 0,
"y": 34
},
"id": 13,
"panels": [
],
"title": "Disk Space",
"type": "row"
},
{
"datasource": {
"type": "prometheus",
"uid": "${datasource}"
},
"fieldConfig": {
"defaults": {
"custom": {
"fillOpacity": 100,
"showPoints": "never",
"stacking": {
"mode": "normal"
}
},
"unit": "percentunit"
}
},
"gridPos": {
"h": 7,
"w": 24,
"x": 0,
"y": 35
},
"id": 14,
"options": {
"legend": {
"showLegend": false
},
"tooltip": {
"mode": "multi",
"sort": "desc"
}
},
"pluginVersion": "v11.4.0",
"targets": [
{
"datasource": {
"type": "prometheus",
"uid": "$datasource"
},
"expr": "sort_desc(1 -\n (\n max without (mountpoint, fstype) (node_filesystem_avail_bytes{job=\"node-exporter\", fstype!=\"\", instance=\"$instance\", cluster=\"$cluster\"})\n /\n max without (mountpoint, fstype) (node_filesystem_size_bytes{job=\"node-exporter\", fstype!=\"\", instance=\"$instance\", cluster=\"$cluster\"})\n ) != 0\n)\n",
"legendFormat": "{{device}}"
}
],
"title": "Disk Space Utilisation",
"type": "timeseries"
}
],
"refresh": "30s",
"schemaVersion": 39,
"tags": [
"node-exporter-mixin"
],
"templating": {
"list": [
{
"name": "datasource",
"query": "prometheus",
"type": "datasource"
},
{
"datasource": {
"type": "prometheus",
"uid": "${datasource}"
},
"hide": 2,
"includeAll": false,
"name": "cluster",
"query": "label_values(node_time_seconds, cluster)",
"refresh": 2,
"sort": 1,
"type": "query"
},
{
"datasource": {
"type": "prometheus",
"uid": "${datasource}"
},
"name": "instance",
"query": "label_values(node_exporter_build_info{job=\"node-exporter\", cluster=\"$cluster\"}, instance)",
"refresh": 2,
"sort": 1,
"type": "query"
}
]
},
"time": {
"from": "now-1h",
"to": "now"
},
"timezone": "utc",
"title": "Node Exporter / USE Method / Node",
"uid": "fac67cfbe174d3ef53eb473d73d9212f"
}概览
这个 JSON 配置定义了一个名为 "Node Exporter / USE Method / Node" 的 Grafana Dashboard。它包含多个监控面板(Panels),每个面板展示不同的系统性能指标,如 CPU、内存、网络、磁盘 I/O 和磁盘空间的使用情况。
主要配置参数
• graphTooltip: 控制工具提示的显示方式。1 表示在鼠标悬停时显示所有数据点的详细信息。
• refresh: 设置 Dashboard 的自动刷新频率为每 30 秒。
• schemaVersion: 表示 Grafana Dashboard 的 schema 版本,这里是 39。
• tags: 给 Dashboard 添加标签,这里是 node-exporter-mixin,便于分类和搜索。
• templating: 定义了变量,用于动态选择数据源、集群和实例。
• time: 默认的时间范围设置为过去 1 小时 (from: "now-1h") 到现在 (to: "now"),时区为 UTC。
• title: Dashboard 的标题。
• uid: Dashboard 的唯一标识符。
模板变量(Templating Variables)
模板变量允许在 Dashboard 中动态选择不同的数据源、集群和实例,从而使 Dashboard 更加灵活和可复用。
定义的变量
• 类型: 数据源选择器。
• 查询: 固定为 prometheus,用户可以选择不同的 Prometheus 数据源。
• 数据源: 使用 ${datasource} 变量指定的数据源。
• 查询: label_values(node_time_seconds, cluster),获取所有集群名称。
• 隐藏: 类型 2 表示在 UI 中隐藏这个变量。
• 数据源: 使用 ${datasource} 变量指定的数据源。
• 查询: label_values(node_exporter_build_info{job="node-exporter", cluster="$cluster"}, instance),根据选定的集群获取对应的实例名称。 这些变量在面板的 Prometheus 查询中以 、cluster 和 $instance 的形式被引用,用于动态过滤数据。
面板结构(Panels)
Dashboard 中的面板分为几个主要部分,每个部分通过一个折叠行(Row)进行组织,下面详细解释每个部分和其包含的面板。
CPU 监控
标题行
{
    "collapsed": false,
    "gridPos": { "h": 1, "w": 24, "x": 0, "y": 0 },
    "id": 1,
    "panels": [],
    "title": "CPU",
    "type": "row"
}
• 作用: 作为 CPU 监控面板的标题,便于视觉上的分组。
• 属性:
a.collapsed: false 表示该行是展开的。
b.gridPos: 定义面板在网格中的位置和大小。
{
    "datasource": { "type": "prometheus", "uid": "
${datasource}" },
    "fieldConfig": { ... },
    "gridPos": { "h": 7, "w": 12, "x": 0, "y": 1 },
    "id": 2,
    "options": { ... },
    "pluginVersion": "v11.4.0",
    "targets": [
        {
            "expr": "instance:node_cpu_utilisation:rate5m{job=\"node-exporter\", instance=\"$instance\", cluster=\"$cluster\"} != 0",
            "legendFormat": "Utilisation"
        }
    ],
    "title": "CPU Utilisation",
    "type": "timeseries"
}
• 作用: 展示 CPU 利用率的时间序列图。
• 主要配置:
a.datasource: 使用定义的 Prometheus 数据源。
b.expr: Prometheus 查询语句,用于计算 CPU 利用率的 5 分钟平均速率。
• 查询解释:
a.instance:node_cpu_utilisation:rate5m: 自定义的 Prometheus 指标,表示每个实例的 CPU 利用率。
b.{job="node-exporter", instance="cluster"}: 过滤条件,根据选择的实例和集群。
c.!= 0: 过滤掉值为 0 的数据点。
• legendFormat: 图例格式,这里显示为 "Utilisation"。
• fieldConfig: 配置字段的显示方式,包括填充透明度、是否显示数据点、堆叠模式和单位(百分比)。
• options: 配置图例显示和工具提示模式。
• type: 图表类型为 timeseries。
{
    "expr": "instance:node_load1_per_cpu:ratio{job=\"node-exporter\", instance=\"$instance\", cluster=\"$cluster\"} != 0",
    "legendFormat": "Saturation"
    ...
    "title": "CPU Saturation (Load1 per CPU",
    "type": "timeseries"
}
• 作用: 展示每个 CPU 的 1 分钟负载比例,用于评估 CPU 的饱和度。
• 主要配置:
a.expr: 查询每个实例每个 CPU 的 1 分钟负载比率。
b.legendFormat: 图例显示为 "Saturation"。
Memory 监控
标题行
{
    "collapsed": false,
    "gridPos": { "h": 1, "w": 24, "x": 0, "y": 8 },
    "id": 4,
    "panels": [],
    "title": "Memory",
    "type": "row"
}
• 作用: 作为内存监控面板的标题。
{
    "expr": "instance:node_memory_utilisation:ratio{job=\"node-exporter\", instance=\"$instance\", cluster=\"$cluster\"} != 0",
    "legendFormat": "Utilisation",
    ...
    "title": "Memory Utilisation",
    "type": "timeseries"
}
• 作用: 展示内存利用率的时间序列图。
• 主要配置:
a.expr: 查询内存利用率比率。
b.legendFormat: 图例显示为 "Utilisation"。
{
    "expr": "instance:node_vmstat_pgmajfault:rate5m{job=\"node-exporter\", instance=\"$instance\", cluster=\"$cluster\"} != 0",
    "legendFormat": "Major page Faults",
    ...
    "title": "Memory Saturation (Major Page Faults)",
    "type": "timeseries"
}
• 作用: 监控主页面错误率,反映内存饱和度。
• 主要配置:
a.expr: 查询每个实例的主页面错误速率。
b. legendFormat: 图例显示为 "Major page Faults"。
Network 监控
标题行
{
    "collapsed": false,
    "gridPos": { "h": 1, "w": 24, "x": 0, "y": 16 },
    "id": 7,
    "panels": [],
    "title": "Network",
    "type": "row"
}
• 作用: 作为网络监控面板的标题。
{
    "expr": "instance:node_network_receive_bytes_excluding_lo:rate5m{job=\"node-exporter\", instance=\"$instance\", cluster=\"$cluster\"} != 0",
    "legendFormat": "Receive",
    {
        "expr": "instance:node_network_transmit_bytes_excluding_lo:rate5m{job=\"node-exporter\", instance=\"$instance\", cluster=\"$cluster\"} != 0",
        "legendFormat": "Transmit"
    },
    ...
    "title": "Network Utilisation (Bytes Receive/Transmit)",
    "type": "timeseries",
    "fieldConfig": {
        "overrides": [
            {
                "matcher": { "id": "byRegexp", "options": "/Transmit/" },
                "properties": [
                    { "id": "custom.transform", "value": "negative-Y" }
                ]
            }
        ]
    }
}
• 作用: 展示网络接收和发送字节数的时间序列图。
• 主要配置:
a.expr: 两个查询分别获取接收(Receive)和发送(Transmit)的字节速率。
b.legendFormat: 分别显示为 "Receive" 和 "Transmit"。
c.fieldConfig.overrides: 将 "Transmit" 数据转换为负值(negative-Y),以便在图表中与接收数据对称显示。
{
    "expr": "instance:node_network_receive_drop_excluding_lo:rate5m{job=\"node-exporter\", instance=\"$instance\", cluster=\"$cluster\"} != 0",
    "legendFormat": "Receive",
    {
        "expr": "instance:node_network_transmit_drop_excluding_lo:rate5m{job=\"node-exporter\", instance=\"$instance\", cluster=\"$cluster\"} != 0",
        "legendFormat": "Transmit"
    },
    ...
    "title": "Network Saturation (Drops Receive/Transmit)",
    "type": "timeseries",
    "fieldConfig": {
        "overrides": [
            {
                "matcher": { "id": "byRegexp", "options": "/Transmit/" },
                "properties": [
                    { "id": "custom.transform", "value": "negative-Y" }
                ]
            }
        ]
    }
}
• 作用: 监控网络接收和发送丢包数的时间序列图。
• 主要配置:
a.expr: 两个查询分别获取接收和发送的丢包速率。
b.legendFormat: 分别显示为 "Receive" 和 "Transmit"。
c.fieldConfig.overrides: 同样将 "Transmit" 数据转换为负值,以便与接收数据对称显示。
Disk IO 监控
标题行
{
    "collapsed": false,
    "gridPos": { "h": 1, "w": 24, "x": 0, "y": 24 },
    "id": 10,
    "panels": [],
    "title": "Disk IO",
    "type": "row"
}
• 作用: 作为磁盘 I/O 监控面板的标题。
{
    "expr": "instance_device:node_disk_io_time_seconds:rate5m{job=\"node-exporter\", instance=\"$instance\", cluster=\"$cluster\"} != 0",
    "legendFormat": "{{device}}",
    ...
    "title": "Disk IO Utilisation",
    "type": "timeseries"
}
• 作用: 展示磁盘 I/O 时间利用率的时间序列图。
• 主要配置:
a.expr: 查询每个设备的 I/O 时间速率。
b.legendFormat: 使用设备名称({{device}})作为图例。
{
    "expr": "instance_device:node_disk_io_time_weighted_seconds:rate5m{job=\"node-exporter\", instance=\"$instance\", cluster=\"$cluster\"} != 0",
    "legendFormat": "{{device}}",
    ...
    "title": "Disk IO Saturation",
    "type": "timeseries"
}
• 作用: 监控加权的磁盘 I/O 时间,反映 I/O 饱和度。
• 主要配置:
a.expr: 查询每个设备的加权 I/O 时间速率。
b. legendFormat: 使用设备名称作为图例。
Disk Space 监控
标题行
{
    "collapsed": false,
    "gridPos": { "h": 1, "w": 24, "x": 0, "y": 34 },
    "id": 13,
    "panels": [],
    "title": "Disk Space",
    "type": "row"
}- • 作用: 作为磁盘空间监控面板的标题。
{
    "expr": "sort_desc(1 -\n  (\n    max without (mountpoint, fstype) (node_filesystem_avail_bytes{job=\"node-exporter\", fstype!=\"\", instance=\"$instance\", cluster=\"$cluster\"})\n    /\n    max without (mountpoint, fstype) (node_filesystem_size_bytes{job=\"node-exporter\", fstype!=\"\", instance=\"$instance\", cluster=\"$cluster\"})\n  ) != 0\n)\n",
    "legendFormat": "{{device}}",
    ...
    "title": "Disk Space Utilisation",
    "type": "timeseries"
}
• 作用: 展示磁盘空间利用率的时间序列图。
• 主要配置:
expr: 复杂的 Prometheus 查询,用于计算磁盘空间的使用率。
1)查询解释:
• node_filesystem_avail_bytes: 可用磁盘空间字节数。
• node_filesystem_size_bytes: 磁盘总空间字节数。
• 计算方法: 1 - (可用空间 / 总空间),即已用空间比例。
• sort_desc: 将结果按降序排序。
• != 0: 过滤掉值为 0 的数据点。
2) legendFormat: 使用设备名称作为图例。
面板配置详解
每个面板的配置结构大致相同,以下是各主要配置项的解释:
datasource
• 描述: 定义该面板使用的数据源,这里统一使用模板变量 ${datasource} 指定的 Prometheus 数据源。
• 格式:
"datasource": {
    "type": "prometheus",
    "uid": "${datasource}"
}
fieldConfig
• 描述: 配置字段的显示属性,包括默认设置和自定义覆盖。
• 主要配置:
1)defaults: 默认字段配置。
• custom.fillOpacity: 填充透明度,值为 100 表示完全不透明。
• custom.showPoints: 是否显示数据点,这里设置为 "never",即不显示。
• custom.stacking.mode: 堆叠模式,这里设置为 "normal",表示正常堆叠。
• unit: 数据的单位,如 percentunit(百分比)、Bps(字节每秒)等。
2) overrides: 允许对特定条件下的字段进行覆盖配置。例如,将 "Transmit" 数据转换为负值。
gridPos
• 描述: 定义面板在 Dashboard 网格中的位置和大小。
• 属性:
a.h: 高度(单位为网格行数)。
b.w: 宽度(单位为网格列数)。
c.x: 水平起始位置(网格列索引)。
d.y: 垂直起始位置(网格行索引)。
targets
• 描述: 定义数据查询的目标,这里主要是 Prometheus 查询。
• 属性:
a.expr: Prometheus 查询表达式。
b.legendFormat: 图例格式,用于标识不同数据系列。
options
• 描述: 定义图表的显示选项。
• 主要配置:
1)legend.showLegend: 是否显示图例,这里设置为 false,即不显示。
2) tooltip: 工具提示的显示模式。
a. mode: "multi" 表示显示多个数据系列的工具提示。
b.sort: "desc" 表示按降序排序数据。
type
• 描述: 定义图表的类型,这里主要使用 timeseries,表示时间序列图。
看完之后,为了加深印象,建议多看几个,大体都是相同的,只不过有一些参数会不一样,有什么不懂的,就直接问 AI ,很方便,要善用工具,不然你会被淘汰。
如果后面需要定制化,那你也可以得心应手。
扩展
我这里还需要再增加额外的 Dashboard,使用 JSON 格式的文件,我就直接在 YAML 文件里面定义了。
ArgoCD
ServiceMonitor
apiVersion: monitoring.coreos.com/v1
kind: ServiceMonitor
metadata:
  name: argocd-servicemonitor
  namespace: monitoring
  labels:
    app.kubernetes.io/name: argocd
    app.kubernetes.io/part-of: argocd
spec:
  selector:
    matchLabels:
      app.kubernetes.io/name: argocd-server  # 需要匹配 ArgoCD 服务的标签
  namespaceSelector:
    matchNames:
      - argocd  # ArgoCD 所在的命名空间
  endpoints:
    - port: metrics  # Prometheus 监控的端口
      path: /metrics      # 监控端点路径
      interval: 30s       # 采样间隔
      scrapeTimeout: 10s  # 超时时间
      tlsConfig:          # 如果需要 TLS 加密,启用以下配置
        insecureSkipVerify: true
一般而言:
• ServiceMonitor 用于监控对应 Service 背后的 Pod 的 Metrics,比较适合被监控 Pod 有一致的 Service 的场景;
• PodMonitor 用于监控对应 Labels 下背后 Pod 的 Metrics,比较适合被监控 Pod 没有 Service 且多个 Pod 部署规则并不统一的场景;
Dashboard JSON 文件
这个太大了,我就不展示了,大家需要的话,可以到这个 地址[1]。
CoreDNS
ServiceMonitor
Prometheus-Operator 自带,所以这边就不用做什么了,只需要关注 Dashboard 的配置了。
Dashboard JSON 文件
这个太大了,我就不展示了,大家需要的话,可以到这个 地址[2]。
修改配置文件
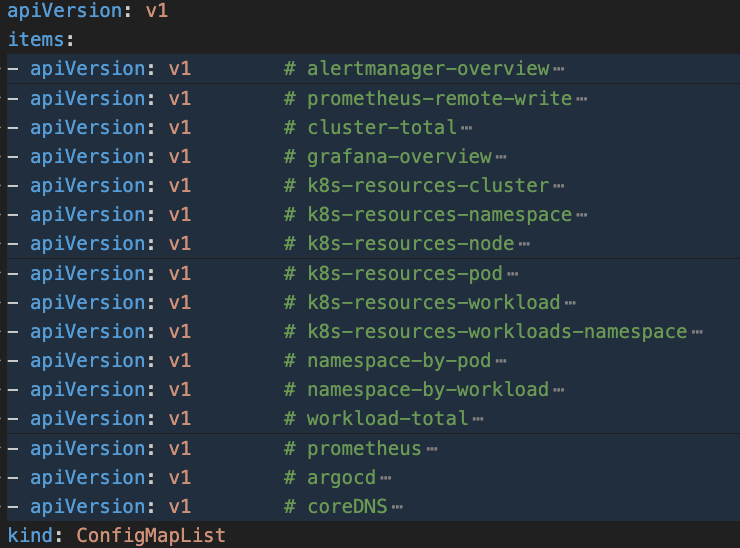
我们需要配置我们的 ConfigMap 然后还有我们的 控制器文件,主要是需要把我们新添加的 Dasboard 挂载到 Grafana 里面,我这里演示一个,后续需要更多,都可以照着这个做:
 图片
图片
可以看到我另外添加了两个,这个时候我们就需要把它挂载到 Grafana 里面了,还有它默认是 Deployment,我这里需要持久化,所以就修改成了 StatefulSet。
apiVersion: apps/v1
kind: StatefulSet
metadata:
  labels:
    app.kubernetes.io/component: grafana
    app.kubernetes.io/name: grafana
    app.kubernetes.io/part-of: kube-prometheus
    app.kubernetes.io/version: 11.4.0
  name: grafana
  namespace: monitoring
spec:
  replicas: 1
  selector:
    matchLabels:
      app.kubernetes.io/component: grafana
      app.kubernetes.io/name: grafana
      app.kubernetes.io/part-of: kube-prometheus
  template:
    metadata:
      annotations:
        checksum/grafana-config: cb0d6303ddbb694464bde843b0fe874c
        checksum/grafana-dashboardproviders: ca302ceedc58d72663436a77e5e0ea29
        checksum/grafana-datasources: b748e773cdfff19dcfe874d29600675b
      labels:
        app.kubernetes.io/component: grafana
        app.kubernetes.io/name: grafana
        app.kubernetes.io/part-of: kube-prometheus
        app.kubernetes.io/version: 11.4.0
    spec:
      automountServiceAccountToken: false
      containers:
      - env: []
        image: grafana/grafana:11.4.0
        name: grafana
        ports:
        - containerPort: 3000
          name: http
        readinessProbe:
          httpGet:
            path: /api/health
            port: http
        resources:
          limits:
            cpu: 200m
            memory: 200Mi
          requests:
            cpu: 100m
            memory: 100Mi
        securityContext:
          allowPrivilegeEscalation: false
          capabilities:
            drop:
            - ALL
          readOnlyRootFilesystem: true
          seccompProfile:
            type: RuntimeDefault
        volumeMounts:
        - mountPath: /var/lib/grafana
          name: grafana-storage
          readOnly: false
        - mountPath: /etc/grafana/provisioning/datasources
          name: grafana-datasources
          readOnly: false
        - mountPath: /etc/grafana/provisioning/dashboards
          name: grafana-dashboards
          readOnly: false
        - mountPath: /tmp
          name: tmp-plugins
          readOnly: false
        - mountPath: /grafana-dashboard-definitions/0/cluster-total
          name: grafana-dashboard-cluster-total
          readOnly: false
        - mountPath: /grafana-dashboard-definitions/0/grafana-overview
          name: grafana-dashboard-grafana-overview
          readOnly: false
        - mountPath: /grafana-dashboard-definitions/0/k8s-resources-cluster
          name: grafana-dashboard-k8s-resources-cluster
          readOnly: false
        - mountPath: /grafana-dashboard-definitions/0/k8s-resources-namespace
          name: grafana-dashboard-k8s-resources-namespace
          readOnly: false
        - mountPath: /grafana-dashboard-definitions/0/k8s-resources-node
          name: grafana-dashboard-k8s-resources-node
          readOnly: false
        - mountPath: /grafana-dashboard-definitions/0/k8s-resources-pod
          name: grafana-dashboard-k8s-resources-pod
          readOnly: false
        - mountPath: /grafana-dashboard-definitions/0/k8s-resources-workload
          name: grafana-dashboard-k8s-resources-workload
          readOnly: false
        - mountPath: /grafana-dashboard-definitions/0/k8s-resources-workloads-namespace
          name: grafana-dashboard-k8s-resources-workloads-namespace
          readOnly: false
        - mountPath: /grafana-dashboard-definitions/0/namespace-by-pod
          name: grafana-dashboard-namespace-by-pod
          readOnly: false
        - mountPath: /grafana-dashboard-definitions/0/namespace-by-workload
          name: grafana-dashboard-namespace-by-workload
          readOnly: false
        - mountPath: /grafana-dashboard-definitions/0/prometheus-remote-write
          name: grafana-dashboard-prometheus-remote-write
          readOnly: false
        - mountPath: /grafana-dashboard-definitions/0/workload-total
          name: grafana-dashboard-workload-total
          readOnly: false
        - mountPath: /grafana-dashboard-definitions/0/prometheus
          name: grafana-dashboard-prometheus
          readOnly: false
        - mountPath: /grafana-dashboard-definitions/0/argocd     # 我们这里需要挂载上去
          name: grafana-dashboard-argocd
          readOnly: false
        - mountPath: /grafana-dashboard-definitions/0/coredns
          name: grafana-dashboard-coredns
          readOnly: false
        - mountPath: /etc/grafana
          name: grafana-config
          readOnly: false
      nodeSelector:
        kubernetes.io/os: linux
      securityContext:
        fsGroup: 65534
        runAsGroup: 65534
        runAsNonRoot: true
        runAsUser: 65534
      serviceAccountName: grafana
      volumes:
      - name: grafana-datasources
        secret:
          secretName: grafana-datasources
      - configMap:
          name: grafana-dashboards
        name: grafana-dashboards
      - emptyDir:
          medium: Memory
        name: tmp-plugins
      - configMap:
          name: grafana-dashboard-cluster-total
        name: grafana-dashboard-cluster-total
      - configMap:
          name: grafana-dashboard-grafana-overview
        name: grafana-dashboard-grafana-overview
      - configMap:
          name: grafana-dashboard-k8s-resources-cluster
        name: grafana-dashboard-k8s-resources-cluster
      - configMap:
          name: grafana-dashboard-k8s-resources-namespace
        name: grafana-dashboard-k8s-resources-namespace
      - configMap:
          name: grafana-dashboard-k8s-resources-node
        name: grafana-dashboard-k8s-resources-node
      - configMap:
          name: grafana-dashboard-k8s-resources-pod
        name: grafana-dashboard-k8s-resources-pod
      - configMap:
          name: grafana-dashboard-k8s-resources-workload
        name: grafana-dashboard-k8s-resources-workload
      - configMap:
          name: grafana-dashboard-k8s-resources-workloads-namespace
        name: grafana-dashboard-k8s-resources-workloads-namespace
      - configMap:
          name: grafana-dashboard-namespace-by-pod
        name: grafana-dashboard-namespace-by-pod
      - configMap:
          name: grafana-dashboard-prometheus-remote-write
        name: grafana-dashboard-prometheus-remote-write
      - configMap:
          name: grafana-dashboard-namespace-by-workload
        name: grafana-dashboard-namespace-by-workload
      - configMap:
          name: grafana-dashboard-workload-total
        name: grafana-dashboard-workload-total
      - configMap:
          name: grafana-dashboard-alertmanager-overview
        name: grafana-dashboard-alertmanager-overview
      - configMap:
          name: grafana-dashboard-prometheus
        name: grafana-dashboard-prometheus
      - configMap:                    # 以下是我们新添加的,我们这里定义好,上面就可以挂载上去
          name: grafana-dashboard-argocd
        name: grafana-dashboard-argocd
      - configMap:
          name: grafana-dashboard-coredns
        name: grafana-dashboard-coredns
      - name: grafana-config
        secret:
          secretName: grafana-config
然后我们这里需要持久化数据:
volumeClaimTemplates:
    - metadata:
        name: grafana-storage
      spec:
        storageClassName: alicloud-nas-subpath
        accessModes:
          - ReadWriteOnce
        resources:
          requests:
            storage: 15Gi
我这里还需要配置下 Grafana 的 Config 文件,主要是做一些优化,把初始化密码定义下:
apiVersion: v1
kind: Secret
metadata:
  labels:
    app.kubernetes.io/component: grafana
    app.kubernetes.io/name: grafana
    app.kubernetes.io/part-of: kube-prometheus
    app.kubernetes.io/version: 11.4.0
  name: grafana-config
  namespace: monitoring
stringData:
  grafana.ini: |
    [date_formats]
    default_timezone = UTC

    [security]
    admin_user = admin
    admin_password = j019e99392129
type: Opaque
然后考虑到我们后续还需要实现相应的 Grafana Reporter 自动化 PDF 报告生成,所以这边就直接优化了:
[rendering]
    concurrent_render_request_limit = 70
结语
后续有些细节还需要再优化下,比如 Dashboard 的展示数据有问题,就需要我们就行修改和优化。
我们的 Grafana 之路到此为止就算结束了。
但是这才是刚刚开始,一个伟大的开始。
引用链接
[1] 地址: https://grafana.com/grafana/dashboards/14584-argocd/[2] 地址: https://grafana.com/grafana/dashboards/14981-coredns/


