Matplotlib是Python中流行的数据可视化库,仅使用简单的几行代码就可以生成图表。但是默认的方法是生成的图表很简单,如果想增强数据演示的影响和清晰度,可以试试本文总结的10个高级技巧,这些技巧可以将可视化提升到一个新的水平:

1、rcParams
rcParams字典。它包含了用于创建图形的默认样式的所有Matplotlib设置。你可以直接从matplotlib命名空间导入它:
from matplotlib import rcParams
 >>> rcParams
 ...
 'axes.grid': False,
 'axes.grid.axis': 'both',
 'axes.grid.which': 'major',
 'axes.labelcolor': 'black',
 'axes.labelpad': 4.0,
 'axes.labelsize': 'medium',
 'axes.labelweight': 'normal',
 'axes.linewidth': 0.8,
 ...

 rcParams['figure.figsize'] = 8, 6
 rcParams['legend.fontsize'] = "large"
 rcParams['xtick.major.size'] = 4
 rcParams['xtick.minor.size'] = 1
这时所有的Matplotlib设置,如果你想修改任何的Matplotlib参数,直接修改这个字典就可以了,你甚至可以将他序列化到本地,然后在其他项目中直接加载,这样你的每一个Matplotlib实例使用的都是相同的配置了。
还可以调用PyPlot的rcdefaults函数,它会将所有参数重置成默认值。
plt.rcdefaults()2、get_* functions
在底层,Matplotlib是完全面向对象的。
 图片
图片
上图中看到的每个单独的组件都是作为一个单独的类实现的。它们都继承自基类Matplotlib Artist。
但是类太多,并且每个类的参数都不一样这会给使用带来很大的不方便,所以Matplotlib定制了有许多以get_前缀开头的函数,可以直接创建图形中的组件。下面是一个例子:
fig, ax = plt.subplots()

 >>> [func for func in dir(ax) if func.startswith("get")]

 ['get_adjustable',
  'get_label',
  'get_legend',
  'get_legend_handles_labels',
  'get_lines',
  'get_navigate',
  'get_title',
  'get_transform',
  'get_xmajorticklabels',
  'get_xminorticklabels',
  'get_xscale',
  'get_xticklabels',
  'get_zorder']
假设我们想自定义一个图形的坐标:
x = np.linspace(0, 2, 100)

 fig, ax = plt.subplots() # Create a figure and an axes.

 l1 = ax.plot(x, x, label="linear")
 l2 = ax.plot(x, x ** 2, label="quadratic")
 l3 = ax.plot(x, x ** 3, label="cubic")

 ax.set_title("Simple Plot")

plt.show()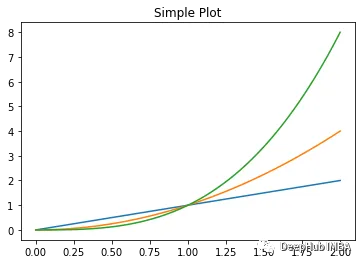 å¾ç
å¾ç
这很简单,只需在axes对象上调用get_xticklabels,就可以得到Matplotlib Text实例的列表:
>>> ax.get_xticklabels()

 [Text(0, 0, 'Ideal'),
  Text(1, 0, 'Premium'),
  Text(2, 0, 'Very Good'),
  Text(3, 0, 'Good'),
  Text(4, 0, 'Fair')]
还可以使用get_xticklines调整刻度线,或者使用get_xticks调整刻度的位置。
已经获得了对象,下面就可以进行调整了
3、get / setp
调用plt.getp函数,可以查看它当前具有的参数。例如,假设我们想要样式化下面图的l2:
x = np.linspace(0, 2, 100)
fig, ax = plt.subplots() # Create a figure and an axes.
l1 = ax.plot(x, x, label="linear")
l2 = ax.plot(x, x ** 2, label="quadratic")
l3 = ax.plot(x, x ** 3, label="cubic")
ax.set_title("Simple Plot")
plt.show()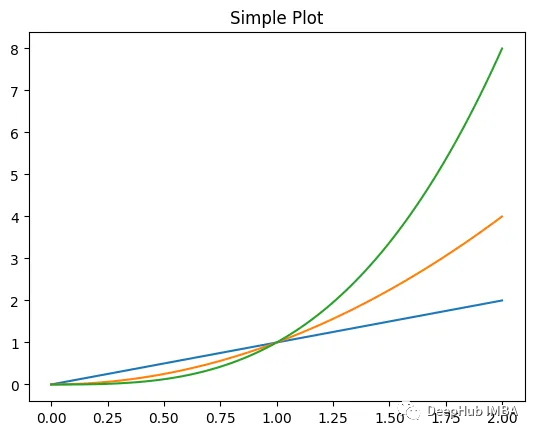 图片
图片
这个方法返回了图表的所有属性
>>> plt.getp(l2)
    ...
    drawstyle or ds = default
    figure = Figure(640x480)
    linestyle or ls = -
    linewidth or lw = 1.5
    marker = None
    markeredgecolor or mec = #ff7f0e
    markeredgewidth or mew = 1.0
    markerfacecolor or mfc = #ff7f0e
    markerfacecoloralt or mfcalt = none
    zorder = 2
    ...
而plt.setp可以更改属性在没有任何参数的对象上调用this会打印出该对象可以接受的属性值:
>>> plt.setp(l2)
  ...
  linestyle or ls: {'-', '--', '-.', ':', '', (offset, on-off-seq), ...}
  linewidth or lw: float
  sketch_params: (scale: float, length: float, randomness: float)
  snap: bool or None
  zorder: float
  ...
要打印单个属性的可能值,可以将属性的名称作为字符串输入setp:
>>> plt.setp(l2, "linestyle")
 linestyle: {'-', '--', '-.', ':', '', (offset, on-off-seq), ...}
修改属性的方法如下:
>>> plt.setp(l2, linestyle="-.", lw=5, color="red", alpha=0.5)
 [None, None, None, None]
要查看更改后的当前图形,只需在图形对象上调用get_figure:
fig.get_figure()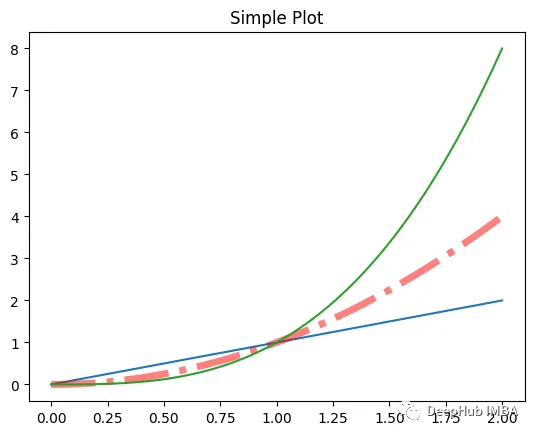 å¾ç
å¾ç
第二行的样式已经变了
4、Legends
Legends可以方便的告诉我们图中每个组件的含义,默认是这样显示的:
x = np.linspace(0, 2, 100)
fig, ax = plt.subplots() # Create a figure and an axes.
l1 = ax.plot(x, x, label="linear")
l2 = ax.plot(x, x ** 2, label="quadratic")
l3 = ax.plot(x, x ** 3, label="cubic")
ax.set_title("Simple Plot")
ax.legend()
plt.show()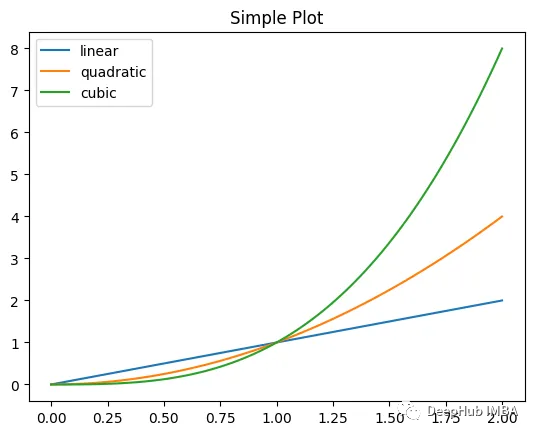 图片
图片
我们可以调整他的参数,例如:
图例的位置、字体属性、大小,颜色,样式、图例中的列数,等等
可以在创建前设置,也可以在创建后使用get_legend提取,并使用getp、setp函数。
5、cycler
你有没有想过Matplotlib是如何自己改变颜色或循环不同风格的?
在底层,Matplotlib使用名为Cyclers的Python内置对象:
from cycler import cycler

 c1 = cycler(arg1=[1, 2, 3, 4])
>>> c1 å¾ç
å¾ç
这个循环函数接受任何键值参数并创建一个字典列表:
c2 = cycler(arg2=list("rgba"))

 for i in c2:
    print(i)

 ------------------------------

 {'arg2': 'r'}
 {'arg2': 'g'}
 {'arg2': 'b'}
 {'arg2': 'a'}
还可以将多个循环器与“plus”和“multiply”操作符组合起来,这样可以获得索引到索引或穷举的参数组合:
for i in c1 + c2:
    print(i)

 --------------------------------

 {'arg1': 1, 'arg2': 'r'}
 {'arg1': 2, 'arg2': 'g'}
 {'arg1': 3, 'arg2': 'b'}
 {'arg1': 4, 'arg2': 'a'}
将这个自定义循环器并将其传递给Matplotlib,就可以定制样式。下面,我们创建四种不同的线条样式,允许Matplotlib循环使用不同的线条颜色,样式和大小:
line_prop_cycler = (
    cycler(color=list("rgcy"))
    + cycler(ls=["-", "--", "-.", ":"])
    + cycler(lw=[3, 6, 9, 12])
 )
可以使用axes对象的set_prop_cycle函数将这个自定义循环器传递给绘图:
x = np.linspace(0, 2 * np.pi, 50)
offsets = np.linspace(0, 2 * np.pi, 4, endpoint=False)
yy = np.transpose([np.sin(x + phi) for phi in offsets])
fig, ax = plt.subplots(figsize=(8, 4))
ax.set_prop_cycle(line_prop_cycler) # Set propcycle before plotting
ax.plot(x, yy)
plt.show();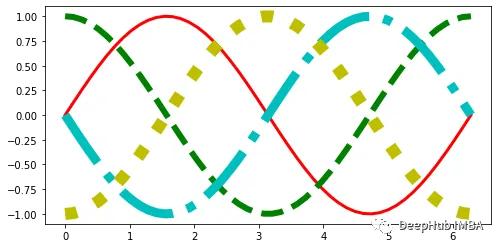 图片
图片
rcParams字典中默认设置如下:
rcParams["axes.prop_cycle"] 图片
图片
我们可以直接修改
6、tick_params
轴刻度应该准确地传达数据点及其单位的最小值和最大值,并显示几个关键的检查点,以便在不同的绘图部分之间进行比较。
大多数tick属性可以使用axes对象的tick_params函数来控制。以下是文档中的例子:
>>> ax.tick_params()

 Parameters
 ----------
 axis : {'x', 'y', 'both'}, default: 'both'
    The axis to which the parameters are applied.
 which : {'major', 'minor', 'both'}, default: 'major'
    The group of ticks to which the parameters are applied.
 reset : bool, default: False
    Whether to reset the ticks to defaults before updating them.

 Other Parameters
 ----------------
 direction : {'in', 'out', 'inout'}
    Puts ticks inside the axes, outside the axes, or both.
 length : float
    Tick length in points.
 width : float
    Tick width in points.
 color : color
    Tick color.
首先应该指定的两个参数是axis和which。这些参数将应用于X或Y轴刻度,以及最小和最大刻度。
大多数时候,在Matplotlib中不会看到小刻度。如果需要可以使用axes对象上的minortics_on函数:
fig, ax = plt.subplots(figsize=(3, 2))

 >>> ax.minorticks_on()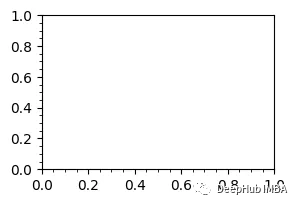
7、Tickers
如果不像自定义tick参数(因为很麻烦)。可以使用许多内置的Matplotlib的“主题”集合(称为tickers)。
from matplotlib import ticker
 dir(ticker)
 ['AutoLocator',
  'AutoMinorLocator',
  'EngFormatter',
  'FixedFormatter',
  'FixedLocator',
  'FormatStrFormatter',
  'Formatter',
  'FuncFormatter',
  'IndexFormatter',
  'IndexLocator',
  'Integral',
  'LinearLocator',
 ]
在ticker模块下有许多这样的子模块。一般情况下标题中带有Locator的控件控制刻度的位置。而Formatters 则表示标签的样式。选择好后可以使用下面的方式进行设置:
from matplotlib.ticker import EngFormatter

 ax.xaxis.set_major_formatter(EngFormatter())
使用axes对象的xaxis或yaxis属性,调用set_major(minor)_formatter(locator)函数,并传入类名。
8、grid
自定义网格线可以突出数据范围。在Matplotlib中,可以使用轴线对象的网格函数创建和自定义网格。下面是一个垂直网格的例子:
fig, ax = plt.subplots()

 ax.grid(axis="x", linestyle=":", lw=3, color="r")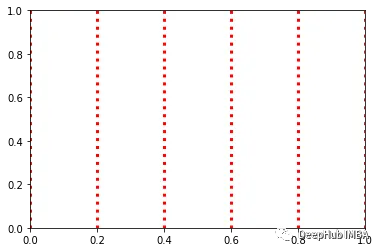
9、bar_label
条形图在数据分析中很常见。它们最重要的地方就是每个条的高度,条形标签可以突出每个条的显示。
bar_label函数接受一个BarContainer对象作为参数,并自动标注每个bar的高度。
下面是Seaborn的一个简单的计数图:
import seaborn as sns

 diamonds = sns.load_dataset("diamonds")

 ax = sns.countplot(diamonds["cut"])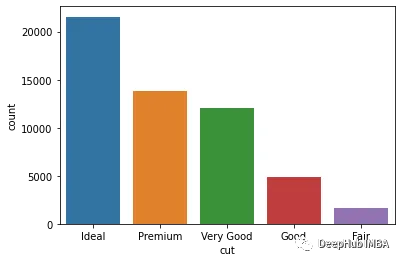
每次使用Seaborn或ax.bar等函数创建barplot时,BarContainer对象都会被添加到图中。可以使用axes对象的containers属性来检索这个容器对象:
ax.containers
 [<BarContainer object of 5 artists>]
在上面的列表中有一个BarContainer对象有5个bar。我们只需在创建了plot之后将这个对象传递给bar_label:
ax = sns.countplot(diamonds["cut"])
 ax.bar_label(ax.containers[0], padding=1)
 ax.set_ylim(0, 25000)
 plt.show();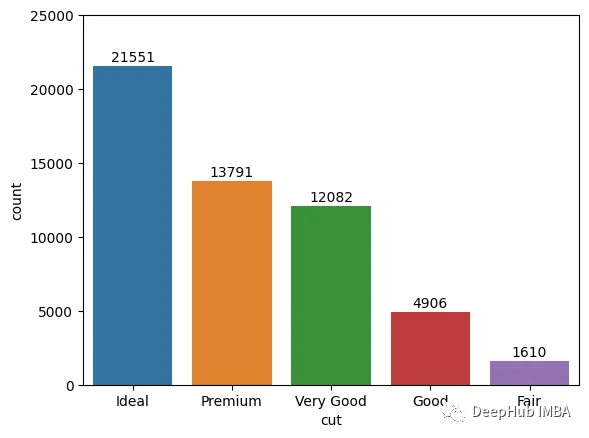
10、zorder
当有很多图的时候,显示顺序是非常重要的。你需要确保在画布上以适当的顺序绘制每个图形,就需要zorder参数。
下面,我们用不同的zorders创建了三行:
x = np.linspace(0, 7.5, 100)

 plt.plot(x, np.sin(x), label="zorder=2", zorder=2) # bottom
 plt.plot(x, np.sin(x + 0.5), label="zorder=3", zorder=3)
 plt.axhline(0, label="zorder=2.5", color="lightgrey", zorder=2.5)

 plt.title("Custom order of elements")

 l = plt.legend(loc="upper right")
 l.set_zorder(2.5) # legend between blue and orange line

 plt.show()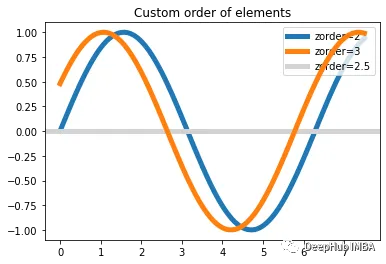
可以看到zorder越大,就会在最上方显示,覆盖掉小的组件。
总结
Matplotlib在2023年6月的下载量超过3000万,几乎是其最大竞争对手Plotly的4倍。Matplotlib的成功不仅仅在于它的简单(只需要几行代码就能生成简单的图形),还在于他的功能强大,但是要使用这些强大的功能就需要使用他的高级功能,但是这些高级功能往往需要比较复杂的配置或者参数,需要我们浏览官方的文档。所以才出现了seaborn,他将Matplotlib进行了整合不仅简单而且好看。
但是有时我们需要更深入的定制功能,seaborn也许还达不到我们的目标,我们只能自己定义的参数,本文总结的是个高级技巧可以轻松的帮你完整自定义Matplotlib的任务。


