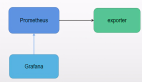
Grafana是一个可视化面板(Dashboard),有着非常漂亮的图表和布局展示,功能齐全的度量仪表盘和图形编辑器,支持Graphite、zabbix、InfluxDB、Prometheus等数据源。

俗话说,没有监控的系统就是在裸奔,好的监控就是运维人员的第三只手,第三只眼。本文将使用prometheus及Grafana搭建一套监控系统来监控主机及数据库(MySQL、Redis)。
一、安装Grafana
Grafana是一个可视化面板(Dashboard),有着非常漂亮的图表和布局展示,功能齐全的度量仪表盘和图形编辑器,支持Graphite、zabbix、InfluxDB、Prometheus等数据源。
1、下载并安装
下载地址:
https://grafana.com/grafana/download。
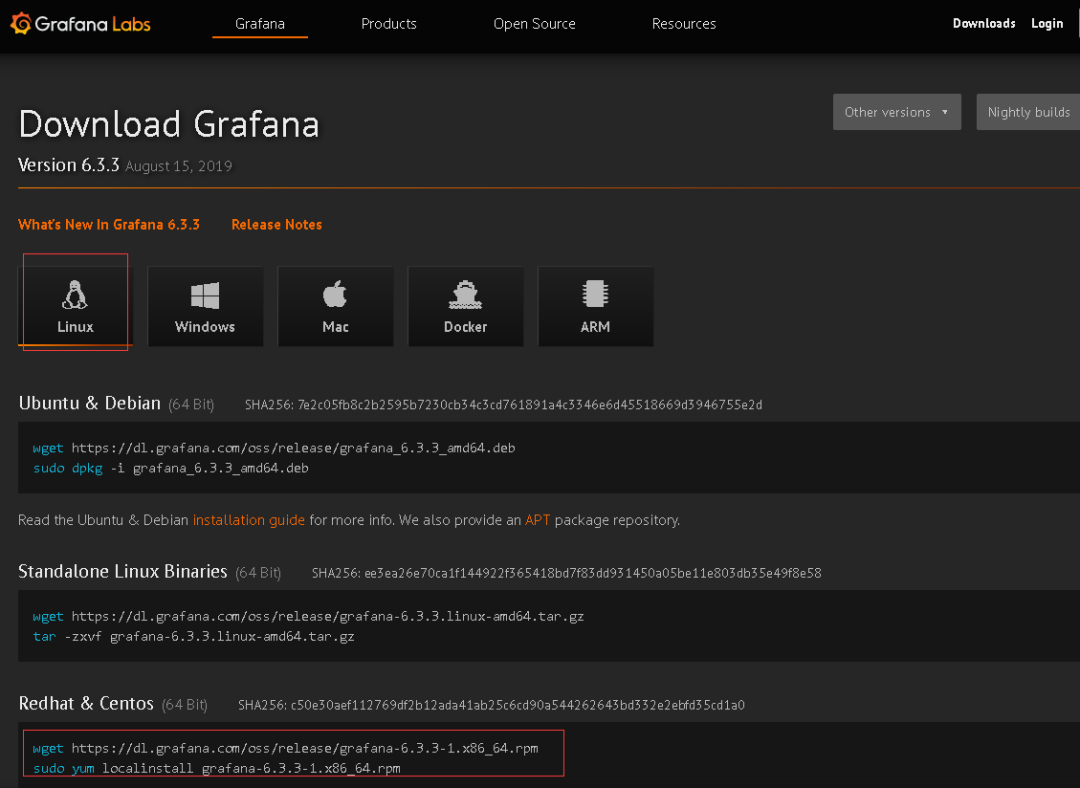
选择最新的版本进行安装,按照网站的提示运行脚本即可(监控服务器需可访问外网,如无法访问外网可与我沟通如何离线快速部署)。
运行如下脚本
wget https://dl.grafana.com/oss/release/grafana-6.3.3-1.x86_64.rpm

sudo yum localinstall grafana-6.3.3-1.x86_64.rpm
2、启动grafana
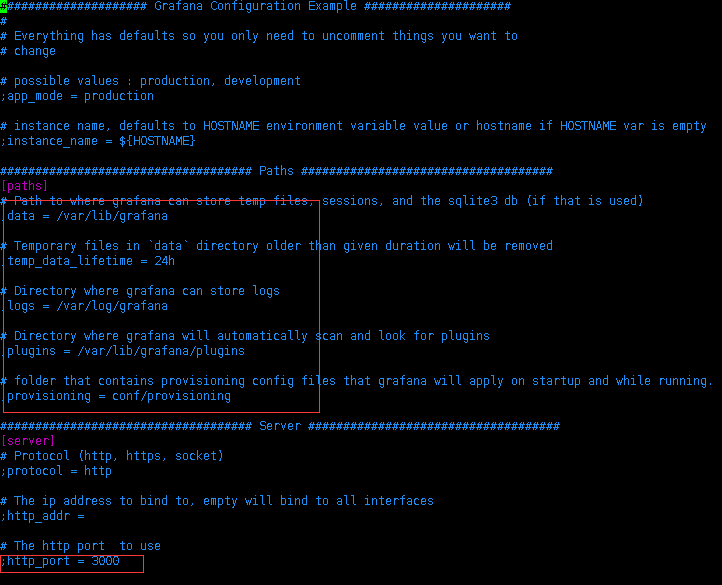
安装完成后,grafana服务默认已安装,配置文件为/etc/grafana/grafana.ini,如需修改路径及端口,可在该文件中修改
启动grafana
/etc/init.d/grafana-server start
3、登录grafana
访问页面http://服务器IP:3000 ,默认账号、密码admin/admin 首次登录将提示修改密码,建议修改。

二、安装Prometheus
1、Prometheus 主程序安装
Prometheus 主程序,主要是负责存储、抓取、聚合、查询方面。
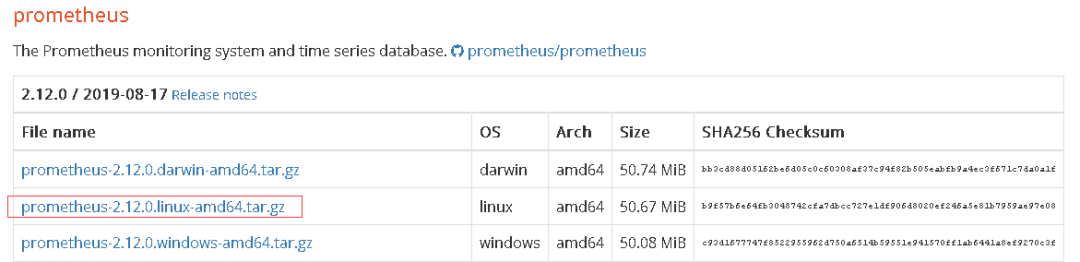
可登录官网进行下载,官网下载地址:
https://prometheus.io/download/
根据操作系统类别选择文件进行下载,本次部署在linux上。
/**  下载*/
wget https://github.com/prometheus/prometheus/releases/download/v2.12.0/prometheus-2.12.0.linux-amd64.tar.gz
/**  解压*/

tar -zxvf prometheus-2.12.0.linux-amd64.tar.gz
2、启动prometheus主程序
生产环境可参考如下方式启动。
/** 生产环境启动*/
nohup ./prometheus --config.file=prometheus.yml --web.enable-lifecycle --storage.tsdb.retention.time=60d   &
/**
 --web.enable-lifecycle  加上此参数可以远程热加载配置文件,无需重启prometheus,调用指令是curl -X POST http://ip:9090/-/reload
-- storage.tsdb.retention.time 数据默认保存时间为15天,启动时加上此参数可以控制数据保存时间
*/
其他的参数及配置可以在prometheus.yml中调整及配置。
三、在需监控的机器上部署exporter
1、监控linux主机
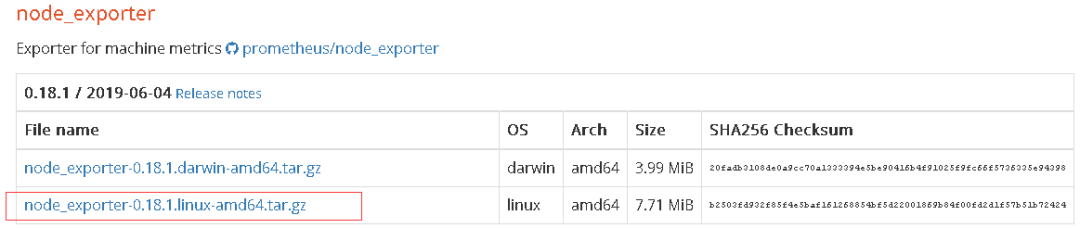
下载监控linux主机的node_exporter,依旧从官网下载。
/**  下载  */
wget https://github.com/prometheus/node_exporter/releases/download/v0.18.1/node_exporter-0.18.1.linux-amd64.tar.gz
/**  解压  */
tar  -zxvf node_exporter-0.18.1.linux-amd64.tar.gz
可以按照默认方式启动
/** 启动 node_exporter*/
cd  node_exporter-0.18.1.linux-amd64
nohup ./node_exporter  &
/**
默认端口9100
*/
2、监控MySQL
(1)下载
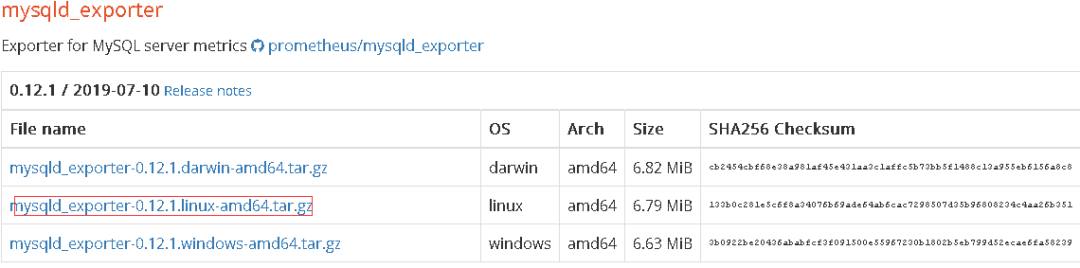
下载监控MySQL的mysqld_exporter,依旧从官网下载
/**  下载  */

wget  https://github.com/prometheus/mysqld_exporter/releases/download/v0.12.1/mysqld_exporter-0.12.1.linux-amd64.tar.gz


/**  解压  */

tar -zxvf  mysqld_exporter-0.12.1.linux-amd64.tar.gz
(2)监控账号及修改文件配置
在MySQL里配置MySQL监控账号。
/**  创建账号  */
mysql> CREATE USER 'mysql_monitor'@'localhost' identified by 'mysql_monitor';
/** 授权 */
mysql> GRANT REPLICATION CLIENT, PROCESS ON *.* TO 'mysql_monitor'@'localhost';
mysql> GRANT SELECT ON performance_schema.* TO 'mysql_monitor'@'localhost';


/**
注意,不用版本对权限要求不一致,启动时注意查看日志,如权限不足则继续授权或创建对应的账号
*/
配置文件修改。
cd mysqld_exporter-0.12.0.linux-amd64


vim .my.cnf
/**  添加如下配置 */
[client]
port=3306
user=mysql_monitor
password=mysql_monitor
(3)启动监控脚本
nohup ./mysqld_exporter --config.my-cnf=.my.cnf &
3、监控redis
(1)下载redis_exporter
官网上没有redis_exporter, 可以从github上获取,另外redis插件无需放在redis机器上也可以
/**  下载  */
wget https://github.com/oliver006/redis_exporter/releases/download/v0.30.0/redis_exporter-v0.30.0.linux-amd64.tar.gz
/**  解压  */
tar -zxvf  redis_exporter-v0.30.0.linux-amd64.tar.gz
(2)启动redis_exporter
/**  redis无密码 */
nohup  ./redis_exporter -redis.addr=192.168.56.118:6379 -web.listen-address 0.0.0.0:9121  &
/**  redis有密码  */
nohup  ./redis_exporter -redis.addr=192.168.56.118:6479 -redis.password 123456   -web.listen-address 0.0.0.0:9122 &
/**
 -web.listen-address  可以自定义监控端口
*/
四、配置prometheus配置文件
1、添加各监控项
配置文件可以有多种配置方式,可以根据不同的分类和习惯配置。可参考如下方式配置
# my global config
global:
  scrape_interval:     15s # Set the scrape interval to every 15 seconds. Default is every 1 minute.
  evaluation_interval: 15s # Evaluate rules every 15 seconds. The default is every 1 minute.
  # scrape_timeout is set to the global default (10s).
# Alertmanager configuration
alerting:
  alertmanagers:
  - static_configs:
    - targets:
      # - alertmanager:9093
# Load rules once and periodically evaluate them according to the global 'evaluation_interval'.
rule_files:
  # - "first_rules.yml"
  # - "second_rules.yml"
# A scrape configuration containing exactly one endpoint to scrape:
# Here it's Prometheus itself.
scrape_configs:
  # The job name is added as a label `job=<job_name>` to any timeseries scraped from this config.
  - job_name: 'prometheus'
    # metrics_path defaults to '/metrics'
    # scheme defaults to 'http'.
    static_configs:
    - targets: ['localhost:9090']
  - job_name: 'OS'
    # metrics_path defaults to '/metrics'
    # scheme defaults to 'http'.
    static_configs:
    - targets: ['192.168.56.114:9100']
      labels:
          instance: '192.168.56.114'

    - targets: ['192.168.56.116:9100']
      labels:
          instance: '192.168.56.116'


    - targets: ['192.168.56.117:9100']
      labels:
          instance: '192.168.56.117'
##  上述job单独做主机监控,每台主机的instance不同
  - job_name: 'mysql'
    # metrics_path defaults to '/metrics'
    # scheme defaults to 'http'.
    static_configs:
    - targets: ['192.168.56.116:9104']
      labels:
          instance: '192.168.56.116'

    - targets: ['192.168.56.117:9104']
      labels:
          instance: '192.168.56.117'
  ## 以上是监控mysql的,instance和主机的instance的相同
  - job_name: 'redis'
    # metrics_path defaults to '/metrics'
    # scheme defaults to 'http'.
    static_configs:
    - targets: ['192.168.56.118:9121','192.168.56.118:9122']
      labels:
          instance: '192.168.56.118'
    - targets: ['192.168.56.118:9100']
      labels:
          instance: '192.168.56.118'
#   可以类似上述这种,redis的主机及各redis监控项组合在一起,instance使用相同的
2、启动或热加载prometheus
/**  启动  */
nohup ./prometheus --config.file=prometheus.yml --web.enable-lifecycle --storage.tsdb.retention.time=60d   &
/**
-- storage.tsdb.retention.time 数据默认保存时间为15天,启动时加上此参数可以控制数据保存时间
*/
/**  热加载  */
curl -X POST http://ip:9090/-/reload
/**
热加载的前提是启动时加了--web.enable-lifecycle
*/
五、配置各监控仪表盘
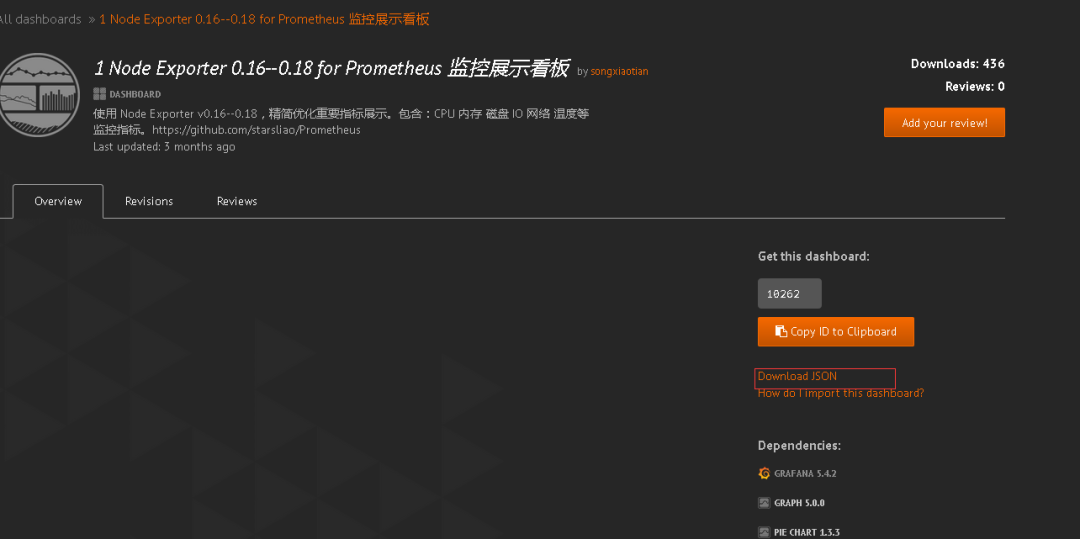
1、下载各监控仪表盘
以上模板grafana官方网站均有,可以根据自己的需要下载对应的模板,对应地址为。
https://grafana.com/grafana/dashboards
找到对应的仪表盘模板后进入下载。
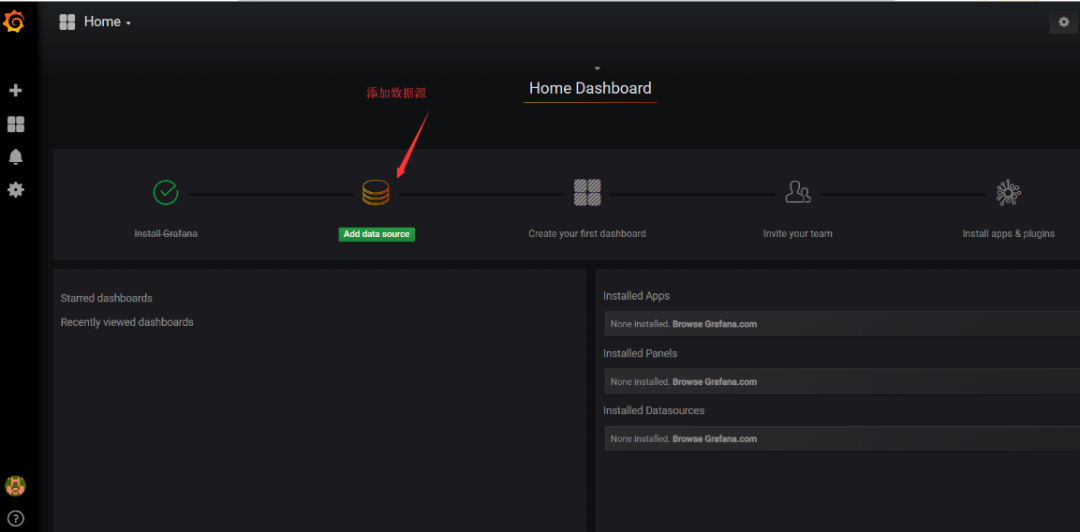
2、配置数据源
本次使用的均为prometheus数据源,因此配置一个prometheus的数据源。
如果之前在grafana上没有配置过数据源 登录后会提示创建。
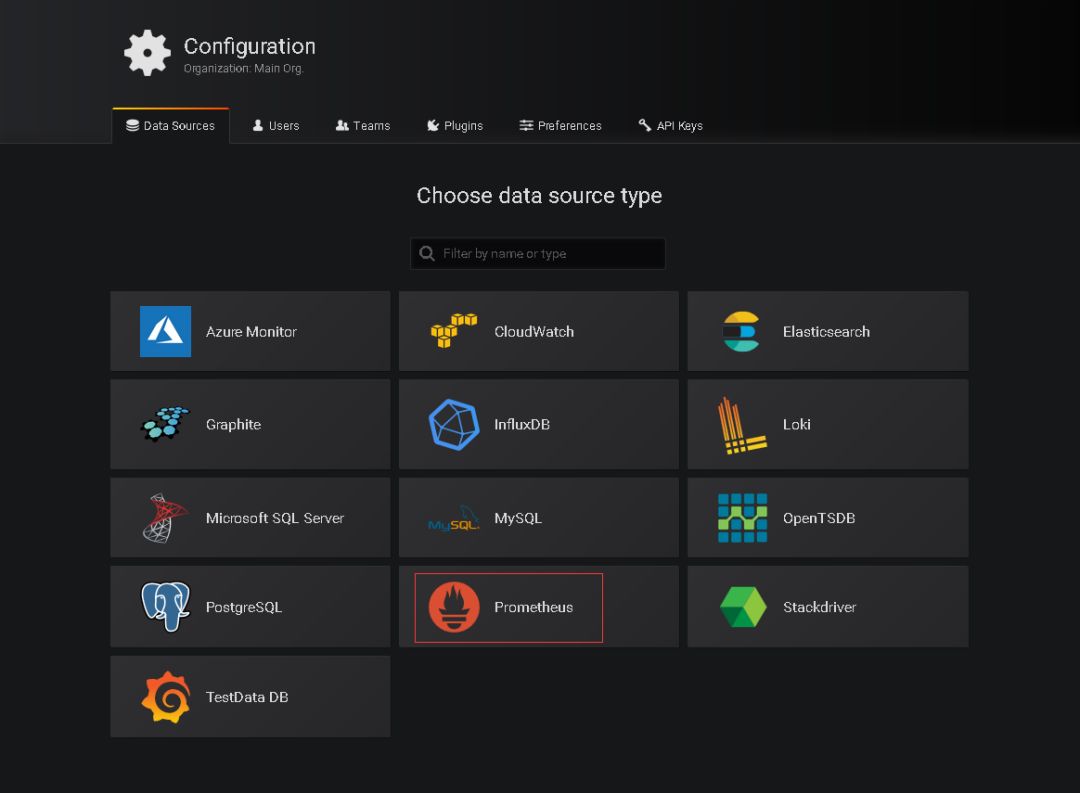
选择prometheus。
配置prometheus地址。
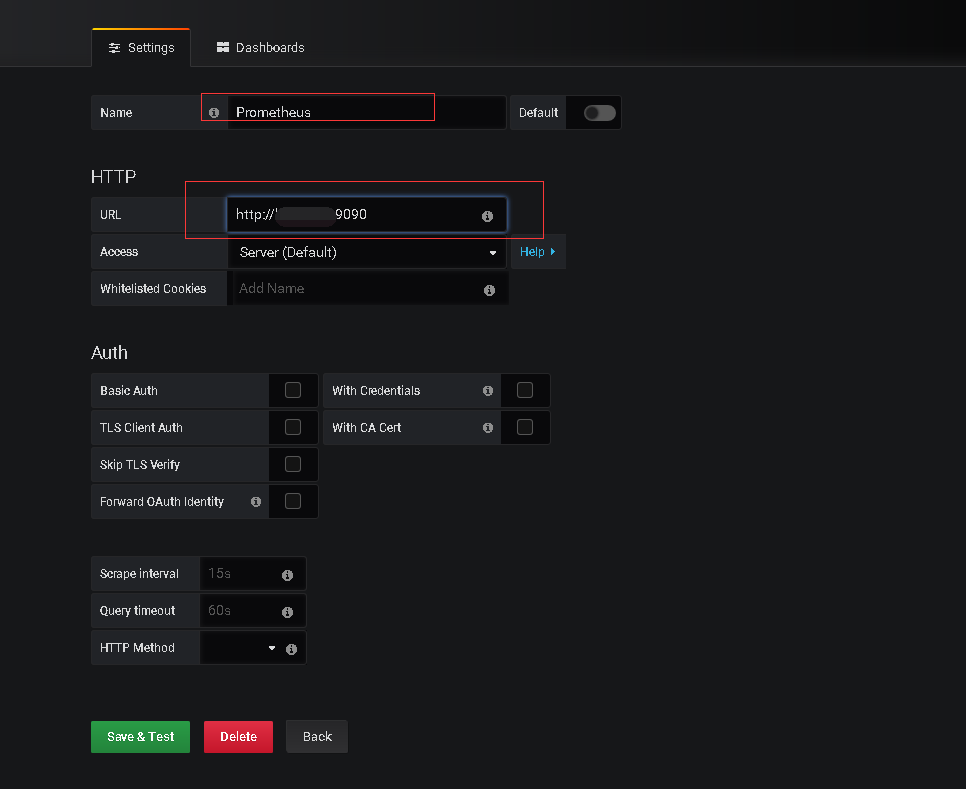
最终save & Test即可。
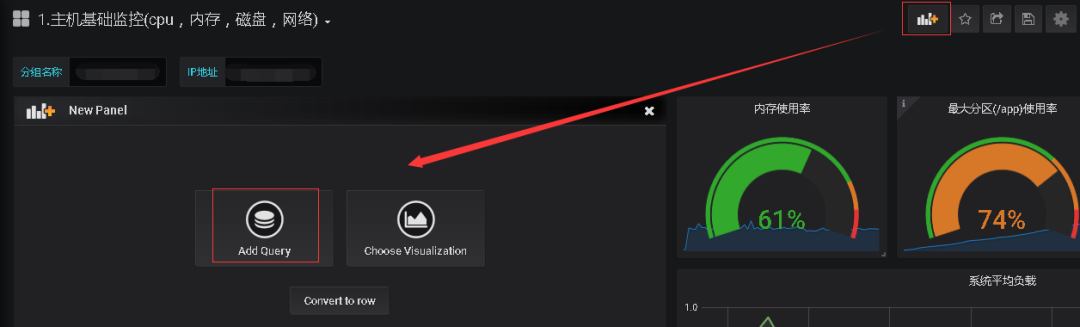
3、导入仪表盘
将5.1中下载的模板导入。
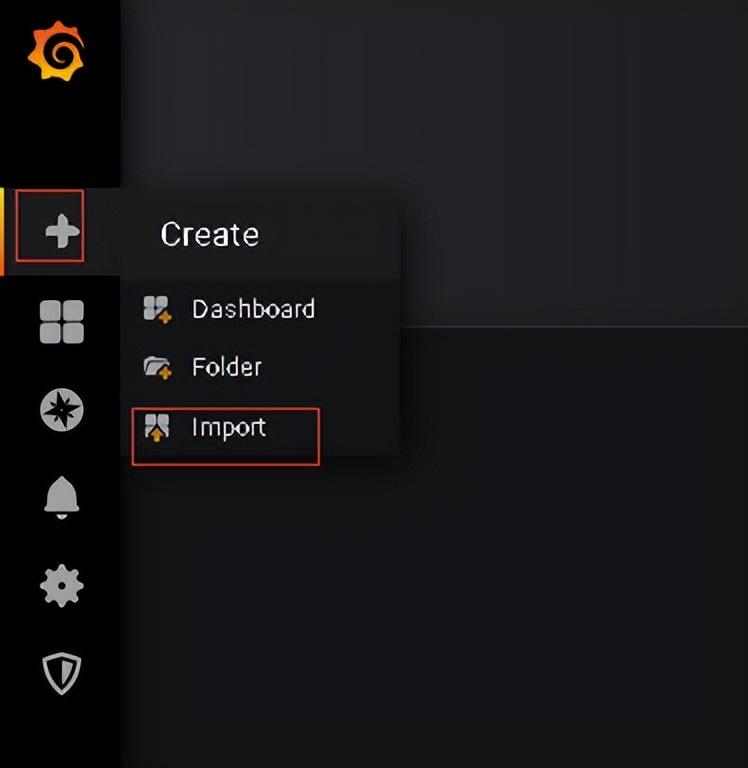
导入:
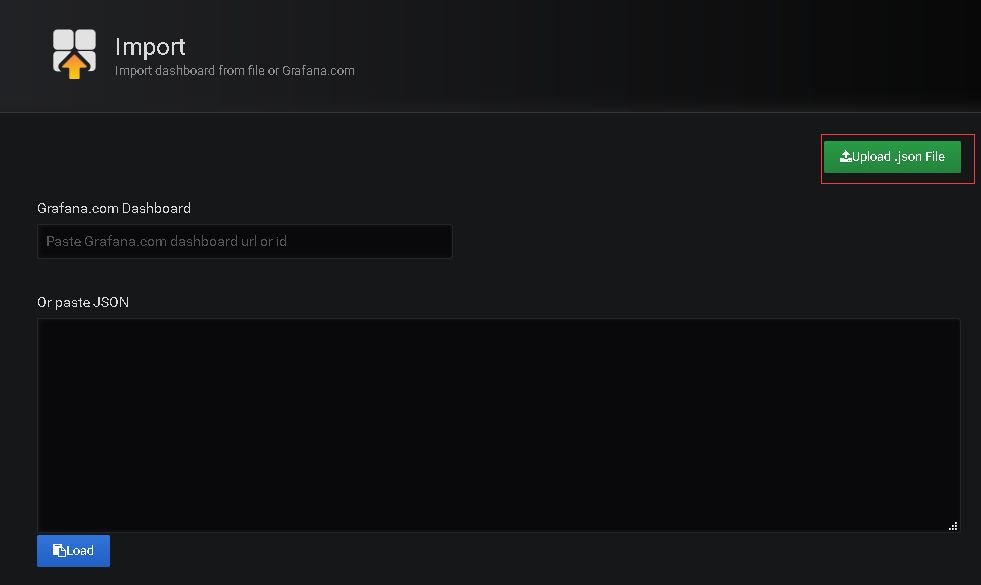
修改名称及数据源。
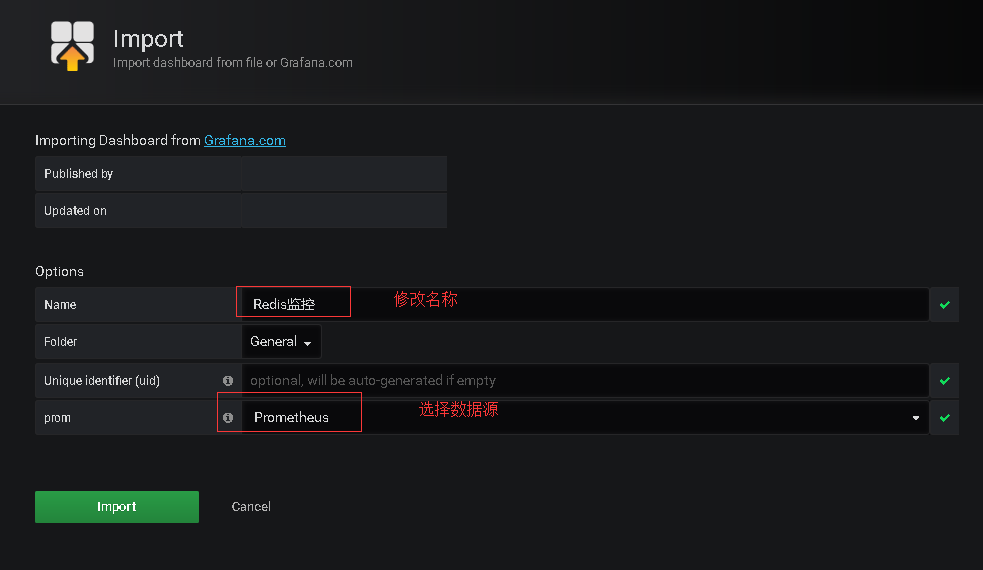
import即可。
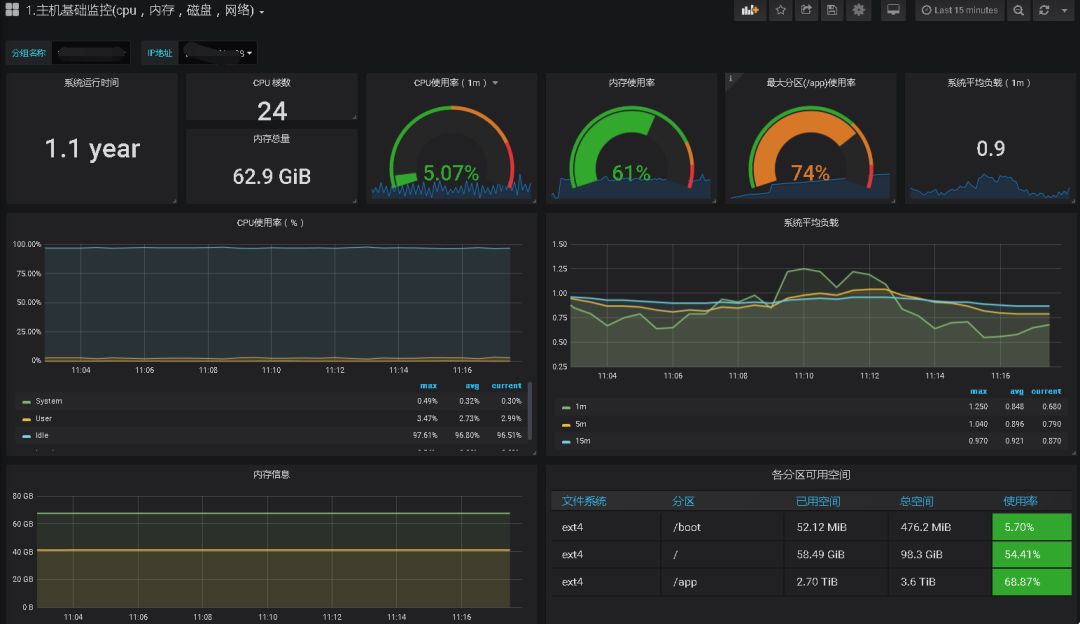
4、配置完成后即可查看各监控情况
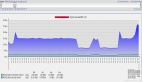
现在可以看一下炫酷的结果了。
主机监控如下:
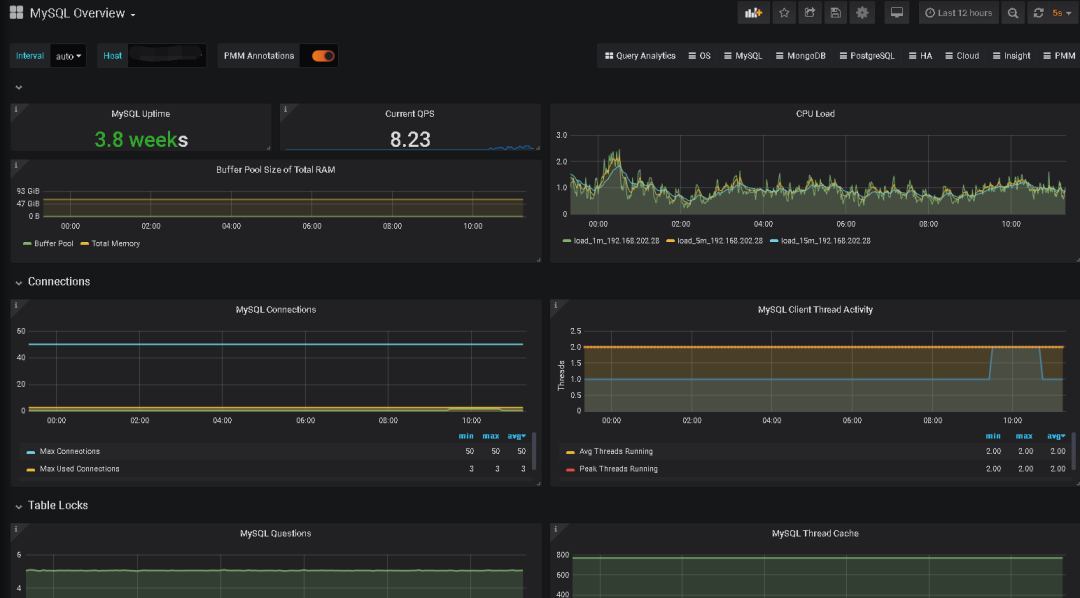
MySQL:
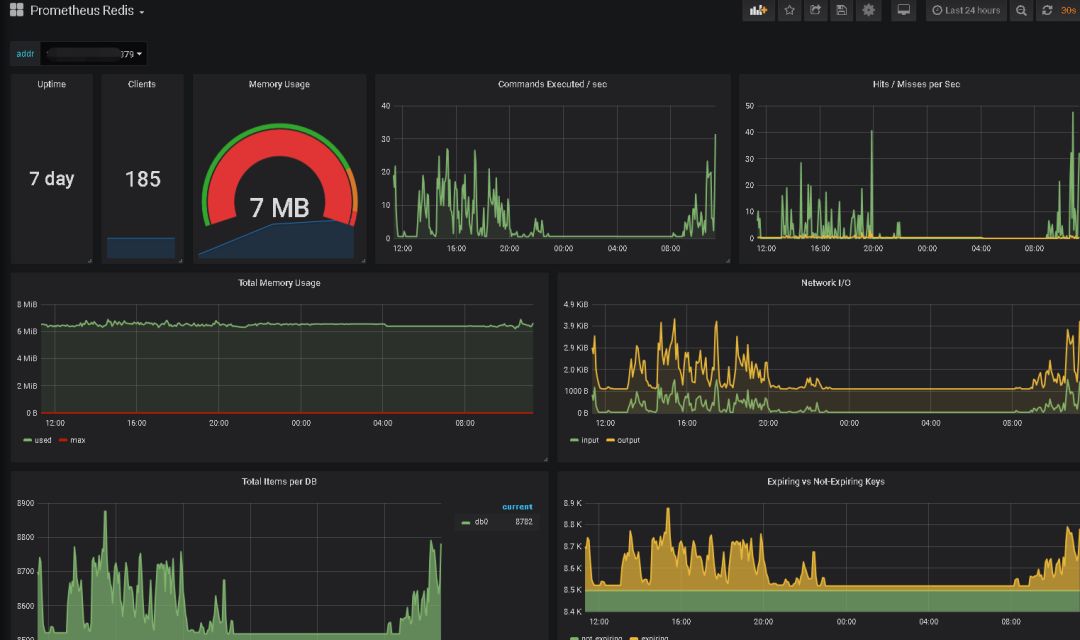
Redis:
其他如果需要其他监控项也可以自定义添加。