struct ChartView1: View {
var body: some View {
VStack {Text("Sample Bar Chart").font(.title)
BarChartView(
title:"the chart title").frame(width:300, height:300, alignment:.center)
Spacer()}}}
1.
2.
3.
4.
5.
6.
7.
8.
9.
10.
11.
12.
13.
14.
struct BarChartView: View {
    var title: String

    var body: some View {
        GeometryReader { gr in
            let headHeight = gr.size.height * 0.10
            VStack {
                ChartHeaderView(title: title, height: headHeight)
                ChartAreaView()
            }
        }
    }
}
1.
2.
3.
4.
5.
6.
7.
8.
9.
10.
11.
12.
13.
struct ChartHeaderView: View {
var title: String
var height: CGFloat
var body: some View {Text(title).frame(height: height)}}
1.
2.
3.
4.
5.
6.
7.
8.
9.
struct ChartAreaView: View {
var body: some View {
ZStack {
RoundedRectangle(cornerRadius:5.0).fill(Color(#colorLiteral(red:0.8906477705, green:0.9005050659, blue:0.8208766097, alpha:1)))}}}
1.
2.
3.
4.
5.
6.
7.
8.
图表区添加条形图
定义一些简单的数据类别,例如一周内每天的步数。以下列表数据被作为主视图的项目数据,每一条数据包含一个对(名称,值)。在真正的 app 里,这里的数据应该通过 ViewModel 从 model 里取数据。
每日步数数据
Day
Steps
Mon
898
Tue
670
Wed
725
Thu
439
Fri
1232
Sat
771
Sun
365
struct DataItem: Identifiable {
let name: String
let value:Double
let id = UUID()}
struct ChartView2: View {
let chartData:[DataItem]=[
DataItem(name:"Mon", value:898),
DataItem(name:"Tue", value:670),
DataItem(name:"Wed", value:725),
DataItem(name:"Thu", value:439),
DataItem(name:"Fri", value:1232),
DataItem(name:"Sat", value:771),
DataItem(name:"Sun", value:365)]
var body: some View {
VStack {Text("Sample Bar Chart").font(.title)
BarChartView(
title:"Daily step count", data: chartData).frame(width:350, height:500, alignment:.center)
Spacer()}}}
1.
2.
3.
4.
5.
6.
7.
8.
9.
10.
11.
12.
13.
14.
15.
16.
17.
18.
19.
20.
21.
22.
23.
24.
25.
26.
27.
28.
29.
30.
31.
更新 BarChartView 使数据可以作为参数传递到 ChartAreaView
struct BarChartView: View {
var title: String
var data:[DataItem]
var body: some View {
GeometryReader { gr in
let headHeight = gr.size.height*0.10
VStack {
ChartHeaderView(title: title, height: headHeight)
ChartAreaView(data: data)}}}}
struct BarView: View {
var name: String
var value:Double
var maxValue:Double
var fullBarHeight:Double
var body: some View {
let barHeight =(Double(fullBarHeight)/ maxValue)* value
VStack {
Spacer()
ZStack {
VStack {
Spacer()
RoundedRectangle(cornerRadius:5.0).fill(Color.blue).frame(height: CGFloat(barHeight), alignment:.trailing)}
VStack {
Spacer()Text("\(value, specifier: "%.0F")").font(.footnote).foregroundColor(.white).fontWeight(.bold)}}Text(name)}.padding(.horizontal,4)}}
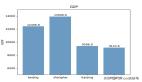
struct ChartView4: View {
let chartData:[DataItem]=[
DataItem(name:"Nigeria", value:117.2),
DataItem(name:"Somalia", value:116.9),
DataItem(name:"Chad", value:113.7),
DataItem(name:"Central African Republic", value:110.0),
DataItem(name:"Sierra Leone", value:109.2),
DataItem(name:"Guinea", value:98.8),
DataItem(name:"South Sudan", value:96.2),
DataItem(name:"Mali", value:94.0),
DataItem(name:"Benin", value:90.2),
DataItem(name:"Burkina Faso", value:87.5)]
var body: some View {
VStack(){
BarChartView(
title:"Under Five Mortality Rates in 2019", data: chartData).frame(width:350, height:500, alignment:.center)Text("Under-five mortality rate:")Text("is the probability of dying between birth and exactly 5 years of age, expressed per 1,000 live births.")
Spacer()}.padding()}}
struct BarView: View {
var name: String
var value:Double
var maxValue:Double
var fullBarHeight:Double
var body: some View {
GeometryReader { gr in
let barHeight =(Double(fullBarHeight)/ maxValue)* value
let textWidth = gr.size.width*0.80
VStack {
Spacer()
RoundedRectangle(cornerRadius:5.0).fill(Color.blue).frame(height: CGFloat(barHeight), alignment:.trailing).overlay(Text("\(value, specifier: "%.0F")").font(.footnote).foregroundColor(.white).fontWeight(.bold).frame(width: textWidth).offset(y:10),
alignment:.top)Text(name).font(.system(size:11)).fontWeight(.semibold).lineLimit(1).frame(width: textWidth)}.padding(.horizontal,4)}}}
struct ChartView5: View {
let chartData:[DataItem]=[
DataItem(name:"NGA", value:117.2),
DataItem(name:"SOM", value:116.9),
DataItem(name:"TCD", value:113.7),
DataItem(name:"CAF", value:110.0),
DataItem(name:"SLE", value:109.2),
DataItem(name:"GIN", value:98.8),
DataItem(name:"SSD", value:96.2),
DataItem(name:"MLI", value:94.0),
DataItem(name:"BEN", value:90.2),
DataItem(name:"BFA", value:87.5)]
var body: some View {
ScrollView {
VStack(){
BarChartView(
title:"Countries with the highest Under Five Mortality Rates in 2019", data: chartData).frame(width:350, height:500, alignment:.center)
Spacer().frame(height:20)
VStack(){Text("Under-five mortality rate:").font(.system(.title2, design:.rounded)).fontWeight(.bold)Text("is the probability of dying between birth and exactly 5 years of age, expressed per 1,000 live births.").font(.body)}.frame(width:300, height:130).background(Color(#colorLiteral(red:0.8906477705, green:0.9005050659, blue:0.8208766097, alpha:1))).cornerRadius(10)
Spacer()}.padding()}}}
1.
2.
3.
4.
5.
6.
7.
8.
9.
10.
11.
12.
13.
14.
15.
16.
17.
18.
19.
20.
21.
22.
23.
24.
25.
26.
27.
28.
29.
30.
31.
32.
33.
34.
35.
36.
37.
38.
39.
40.
41.
结语
在 SwiftUI 中组合矩形来创建条形图是比较容易的。SwiftUI 是一个很好的平台,用于创建视图和快速重构独立的子视图。在 SwiftUI 中构建条形图需要做一些工作,随着使用数据来试用条形图,可以确定更多的定制化。使用 GeometryReader 可以创建适应更多可用环境的条形图。在这篇文章中,我们创建了一个简单的条形图,有数值,下面有标签,还有图表的标题,下一步就是分离出 x 轴和 y 轴。