本篇文章整列了2个简单的代码片段,可以让你的图表动起来。

动画
Python中有许多用于绘制图形的库。Matplotlib, Seaborn, Bokeh, Plotly等等。
但是我们绘图的目的是要向听众和要传递的信息。如果你的图能够动起来那么他们肯定会让听众在看第一眼的时候就印象深刻。但是并不是每个图形或数据集都适合动画。一般情况下,动画对时间序列来说非常有效。例如,根据时间变化进行数据的对比。
Plotly Express
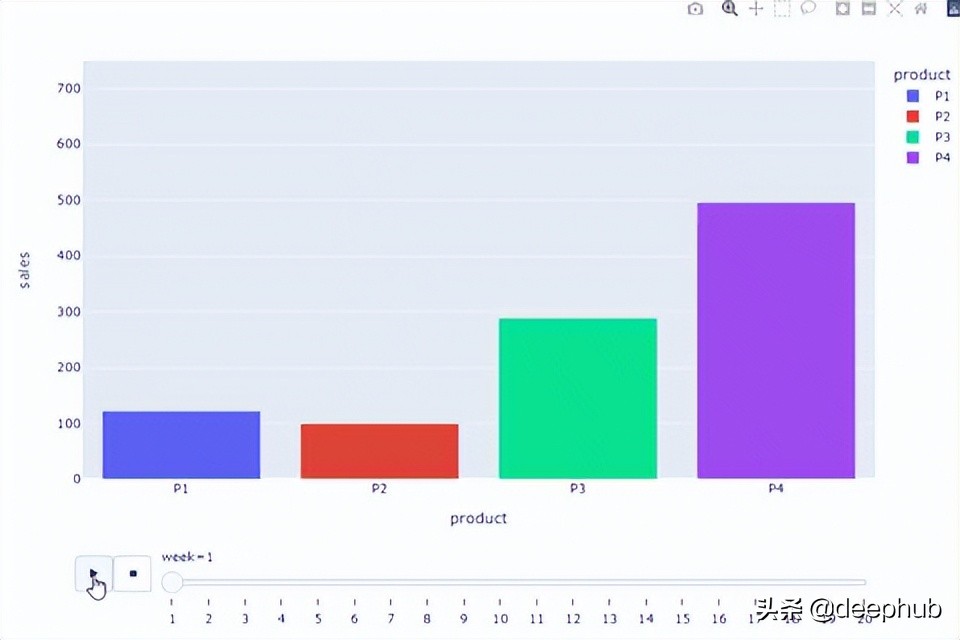
Plotly Express,可以直接为我们创建动态图表:
import plotly.express as px
import pandas as pd
import numpy as np- 1.
- 2.
- 3.
让我们在数据集中创建一些值。
df = pd.DataFrame( {'week': np.random.randint(1,21, size=200),
'P1': np.random.randint(10,220, size=200),
'P2': np.random.randint(15,200, size=200),
'P3': np.random.randint(10,490, size=200),
'P4': np.random.randint(10,980, size=200) } )
df = pd.DataFrame( {'week': np.random.randint(1,21, size=200),
'P1': np.random.randint(10,220, size=200),
'P2': np.random.randint(15,200, size=200),
'P3': np.random.randint(10,490, size=200),
'P4': np.random.randint(10,980, size=200) } )- 1.
- 2.
- 3.
- 4.
- 5.
- 6.
- 7.
- 8.
- 9.
- 10.
现在我们可以绘制一个动画图来查看产品按周的变化情况。

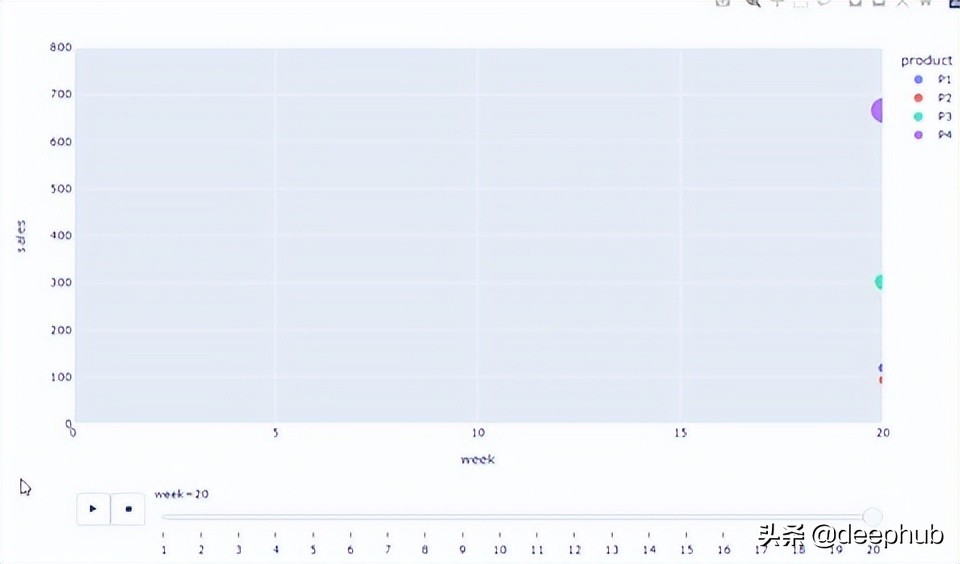
创建散点图动画也同样简单。
fig = px.scatter(df, x="week", y="sales", animation_frame="week", animation_group="product", size="sales", color="product", hover_name="product", range_x=[0,20], range_y=[0,800])
fig.update_layout(height=600, width=1000)- 1.
- 2.

gif库
如果你向我一样是matplot和seaborn的粉丝,并且不太喜欢用Plotly的话,那么可以试试这个库。这个库的作用是创建一系列绘图,并将它们放在一个帧序列中并创建一个动态的gif图。
首先,还是获取一些用于绘图的时间序列数据。
import seaborn as sns
df = sns.load_dataset('flights')- 1.
- 2.
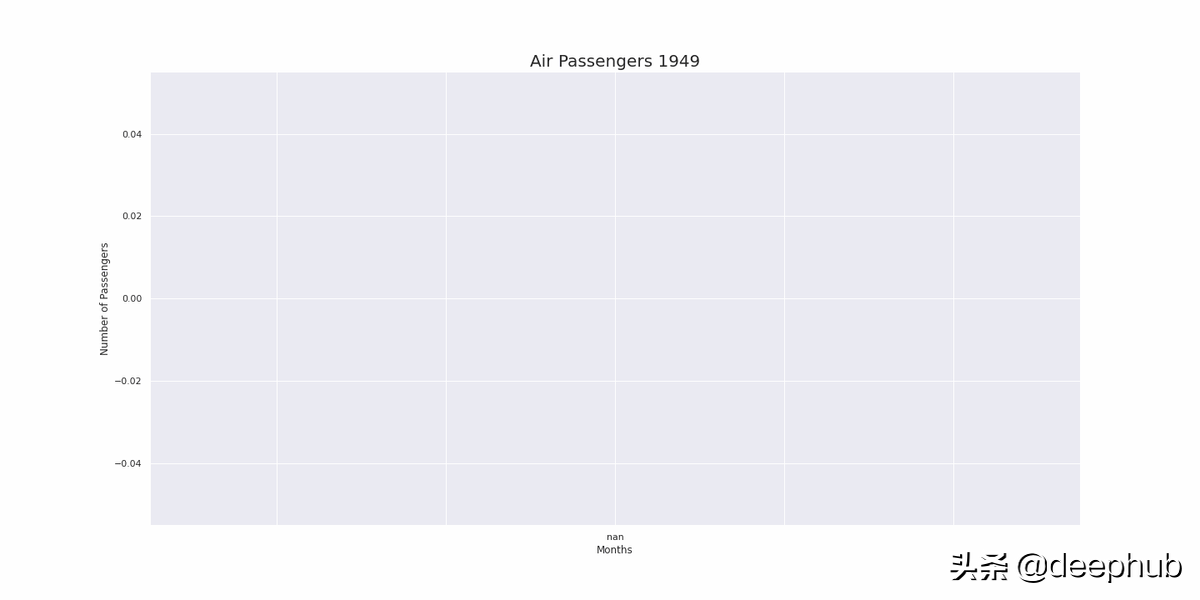
接下来创建一个函数,该函数将为每个观察创建一个绘图。
@gif.frame
def plot_flights(df, i):
df = df.copy()
# Get the year for the plot title
yr = df['year'][i]
# Force X axis to be entirely plotted at once
df.iloc[i:] = np.nan
#Plot
ax = df.plot(x='month', y= 'passengers', legend=False,
style="o-", figsize=(20,10))
ax.set_title(f"Air Passengers {yr}", size=20)
ax.set_xlabel("Months")
ax.set_ylabel("Number of Passengers")- 1.
- 2.
- 3.
- 4.
- 5.
- 6.
- 7.
- 8.
- 9.
- 10.
- 11.
- 12.
- 13.
@gif.frame是GIF库用来创建帧序列的装饰器。
df.iloc[i:] = np.nan将把所有未来的数据转换到NA。这是一种每次只绘制一个值的编程方式(i=0所有都为nan, i=1,只绘制索引0,i=2,只绘制0和1…),通过这种方法我们可以端到端绘制X轴,因为在动画期间是不会改变的。这样也可以保持图表的大小不变,使其更容易观看。
现在我们使用函数创建一个循环来创建帧。
frames = []
for i in range(df.shape[0]):
frame = plot_flights(df, i)
frames.append(frame)- 1.
- 2.
- 3.
- 4.
最后,保存生成的GIF图像。
gif.save(frames, 'gif_example.gif', duration=180)- 1.

看,是不是很简单
最后总结
动画图是一个很有影响力的展示方法,但是并不是所有的图都适合动画化。我们应该根据实际的情况来选择是否需要创建动画图,因为动画图并不是深入分析的最佳选择他只是在视觉上有一些更大的冲击,所以当你需要观察、比较和理解时也许静态图是更好的选择。
要创建动图,我建议您使用gif库,因为对于这种图形类型,它比plotly更简单(因为我个人更喜欢seaborn,哈)。


