
前言
鸿蒙已经提供了chart组件来实现数据可视化的需求,那么,我们该如何自定义一个chart组件来实现数据可视化呢?本文将运用canvas来自定义一个简单的饼状图组件。
饼状图
<div style="flex-direction: column;align-items: center;">
    <canvas ref="canvas1" class="canvas1" style="width: 360px; height: 400px;             background-color: #fff;margin-bottom: 30px;"                                   @touchstart="select"></canvas>
    <input type="button" style="width: 180px; height: 60px;" value="画图"
           onclick="draw" />
</div>
首先我们需要创建一个画布,接下来我们所有操作都将在画布上进行。
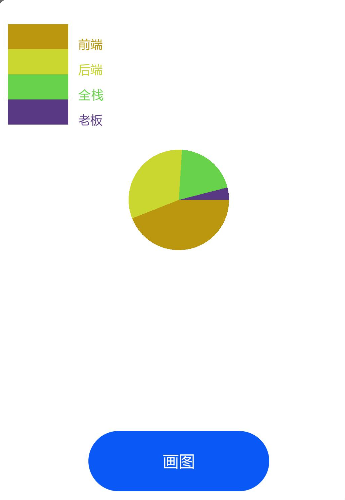
饼状图主要由两部分组成,矩形阵来表示数据,饼图进行操作。饼状图由下面画图按钮点击同时生成。
用到的数据很简单。
ary:[   {title:'前端', num: 11},
        {title:'后端', num: 8},
        {title:'全栈', num: 5},
        {title:'老板', num: 1},
    ]
计算总数,转换弧度
drawAngle() {
    this.ary.map((item, index) => {
        this.total += item.num;
    });
    let total = this.total
    this.ary.map(function (item, index) {
    let angle = (item.num / total) * Math.PI * 2; //计算在饼状图中每一块对应的弧度        item.angle = angle;
    });
        return this.ary
},
将拿到的数据,算出总数,然后算出各自对应的弧度,为在饼图上显示做铺垫。
颜色填充
randomColor() {
  // Math.floor(x) 返回小于等于x的最大整数
  // Math.random() 返回介于 0(包含) ~ 256(不包含) 之间的一个随机数
  let r = Math.floor(Math.random() * 256);
  let g = Math.floor(Math.random() * 256);
  let b = Math.floor(Math.random() * 256);
  return "rgb(" + r + "," + g + "," + b + ")";
},
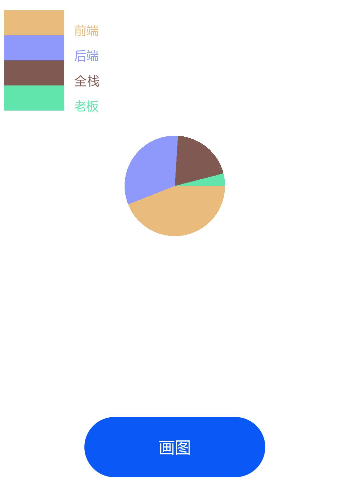
饼图上是需要颜色填充的,不然就是一块白板,我在这使用的随机颜色,只要刷新代码,点击画图按钮,重新生成的饼图的颜色就会不一样,如果大家有更好的想法,欢迎随时交流。
生成饼图
draw() {
    if(this.flag == false) {
        this.flag = true;
        this.el = this.$refs.canvas1;
        this.ctx = this.el.getContext('2d');
        // 获取画布中心
        this.xCenter = JSON.parse(JSON.stringify(this.el.style.width).replace('px','')) / 2;
        this.yCenter = JSON.parse(JSON.stringify(this.el.style.height).replace('px','')) / 2;
        let angleList = this.drawAngle();
        let start = 0; //起始弧度
        angleList.map((item, index) => {
            let end = item.angle + start; //终止弧度
            this.end.push(end);
            this.ctx.beginPath();
            this.ctx.moveTo(this.xCenter,this.yCenter);
            this.ctx.arc(this.xCenter, this.yCenter, ARC_RADIUS, start, end);
            this.ctx.fillStyle = this.randomColor();  //填充颜色
            this.color.push(this.ctx.fillStyle);
            this.ctx.fill();
            start = end;
                // 画小矩形
            this.drawInfo(index, item.title, this.ctx.fillStyle);
        })
    }else {
        return
    }
},
在画饼图之前,首先要确定的就是饼图的中心位置,目的是以这个中心位置为圆心画一个圆。
由于在canvas标签上的宽高自带px(像素),在进行计算之前,需要先处理一下,我这里是用空格替代px,处理好数据后除以2,就得到了圆心的坐标。
将之前计算好的弧度列表遍历,各自定义一个起始弧度和终止弧度,我在最后写了一行start=end,是为了确定每一个扇形各自的起始弧度和终止弧度。选好填充的颜色,然后画一个圆。
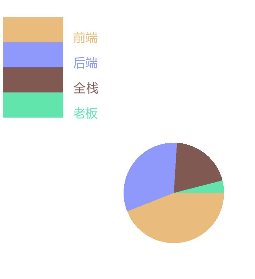
画矩形阵
drawInfo(index,text,color) {
    this.ctx.beginPath();    // 画小矩形
    this.ctx.fillRect(SPACEX, SPACEY * index + SMALL_H, SMALL_W, SMALL_H);
    this.ctx.font = "12px 微软雅黑";
    this.ctx.fillStyle = color;
    this.ctx.textAlign="left";
    this.ctx.fillText(text, SPACEX * 2 + SMALL_W, SPACEY * index + SMALL_H * 2);
},
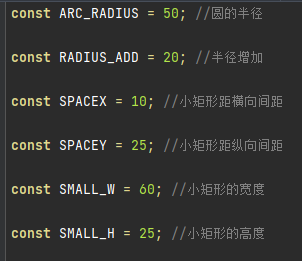
上图是用到的一些常量值。
矩形阵在画圆的方法里面调用的,所以在点击画圆按钮的时候,同时会出现。
选择扇形图
select(e) {
    let globalX = e.touches[0].globalX; //鼠标点击X坐标
    let globalY = e.touches[0].globalY; //鼠标点击Y坐标
    this.mouseRadio = Math.sqrt(Math.pow(globalX-this.xCenter,                  2)+Math.pow(globalY-this.yCenter, 2));
    // 鼠标点击位置的向量坐标
    let vecX = globalX - this.xCenter;
    let vecY = globalY - this.yCenter;
    if(this.flagTwo == false) {
        this.flagTwo = true;
        this.end.splice(0, 0, 0); // 给该数组第一个位置加一个0
    }
    // 通过向量的点积来计算cos
    let cos =  (vecX * ARC_RADIUS + 0 * vecY) / (Math.sqrt(vecX * vecX + vecY *      vecY)  * ARC_RADIUS);
    let cliAngel = 0; // 当前点击点的弧度值
    // 以圆心为坐标轴,通过判断y的正负值,来取当前点击的弧度值
    if (globalY > this.yCenter) {
        cliAngel = Math.acos(cos);
    }else{
        cliAngel = Math.PI * 2 - Math.acos(cos);
    }
    let angelI = this.countRange(this.end,cliAngel) // 当前点击点的弧度值在数组中对应的下标
    console.log("angel:" + angelI);
    // 判断点击是否在半径为ARC_RADIUS的圆内
    if(this.mouseRadio < ARC_RADIUS) {
        console.info('在圈内' + this.mouseRadio);
        this.ctx.beginPath();
        this.ctx.moveTo(this.xCenter,this.yCenter);
        this.ctx.arc(this.xCenter, this.yCenter, ARC_RADIUS + RADIUS_ADD,this.end[angelI-1], this.end[angelI]);
        this.ctx.fillStyle = this.color[angelI-1];
        this.ctx.fill();
    } else {
        console.info('在圈外' + this.mouseRadio);
        this.ctx.beginPath();
        this.ctx.moveTo(this.xCenter,this.yCenter);
        this.ctx.arc(this.xCenter, this.yCenter, ARC_RADIUS + RADIUS_ADD,this.end[angelI-1], this.end[angelI]);
        this.ctx.fillStyle = '#fff';
        this.ctx.fill();
        this.ctx.beginPath();
        this.ctx.moveTo(this.xCenter,this.yCenter);
        this.ctx.arc(this.xCenter, this.yCenter, ARC_RADIUS ,this.end[angelI-1], this.end[angelI]);
        this.ctx.fillStyle = this.color[angelI-1];
        this.ctx.fill();
    }
}
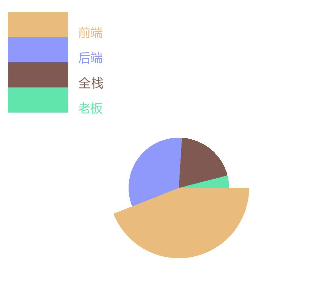
我在选择扇形图事件里加入了点击选择扇形图后,扇形图会有样式变化,如上图。
首先得知道鼠标点击的X、Y坐标,通过坐标算出当前点击坐标离圆心的距离,用来判断当前点击的坐标是否在圆内。
然后我们需要算出鼠标点击位置的向量坐标,在通过向量的点积来计算cos,以圆心为坐标轴,通过判断Y的正负值,取到当前点击的弧度值。通过计算出来的当前点击点的弧度值在数组中对应的下标,知道点击是哪一块扇形,并匹配相应的背景颜色,点击后,当前被点击的扇形样式就会发生变化。
最后通过判断点击的坐标是否在圆内,来决定扇形的样式。逻辑是,点击在圆内,放大,点击在在圆外,缩小。
注:其实在这里,并没有去修改扇形的样式,只是通过画新的圆,从视觉上达到所要实现的效果。
总结
本文仅仅实现了饼状图的基本功能(一部分功能因为影响功能展示并未放上来)。


