本文转载自微信公众号「python与大数据分析」,作者一只小小鸟鸟 。转载本文请联系python与大数据分析公众号。
导数(Derivative),也叫导函数值。又名微商,是微积分中的重要基础概念。当函数y=f(x)的自变量x在一点x0上产生一个增量Δx时,函数输出值的增量Δy与自变量增量Δx的比值在Δx趋于0时的极限a如果存在,a即为在x0处的导数,记作f'(x0)或df(x0)/dx。
不是所有的函数都有导数,一个函数也不一定在所有的点上都有导数。若某函数在某一点导数存在,则称其在这一点可导,否则称为不可导。然而,可导的函数一定连续;不连续的函数一定不可导。
切线指的是一条刚好触碰到曲线上某一点的直线。更准确地说,当切线经过曲线上的某点(即切点)时,切线的方向与曲线上该点的方向是相同的。平面几何中,将和圆只有一个公共交点的直线叫做圆的切线。
法线(normal line),是指始终垂直于某平面的直线。在几何学中,法线指平面上垂直于曲线在某点的切线的一条线。法线也应用于光学的平面镜反射上。
- #!/usr/bin/env python
- # -*- coding: UTF-8 -*-
- # _ooOoo_
- # o8888888o
- # 88" . "88
- # ( | - _ - | )
- # O\ = /O
- # ____/`---'\____
- # .' \\| |// `.
- # / \\|||:|||// \
- # / _|||||-:- |||||- \
- # | | \\\ - /// | |
- # | \_| ''\---/'' | _/ |
- # \ .-\__ `-` ___/-. /
- # ___`. .' /--.--\ `. . __
- # ."" '< `.___\_<|>_/___.' >'"".
- # | | : `- \`.;`\ _ /`;.`/ - ` : | |
- # \ \ `-. \_ __\ /__ _/ .-` / /
- # ==`-.____`-.___\_____/___.-`____.-'==
- # `=---='
- '''
- @Project :pythonalgorithms
- @File :derivatives.py
- @Author :不胜人生一场醉@Date :2021/8/1 0:17
- '''
- import matplotlib.pyplot as plt
- import numpy as np
- import math
- import sympy
- import mpl_toolkits.axisartist as axisartist # 导入坐标轴加工模块
- if __name__ == '__main__':
- quadraticderivativeplot()
- exponentialderivativeplot()
- arccscderivativeplot()
- # 导数(Derivative),也叫导函数值。又名微商,是微积分中的重要基础概念。
- # 当函数y=f(x)的自变量x在一点x0上产生一个增量Δx时,函数输出值的增量Δy与自变量增量Δx的比值在Δx趋于0时的极限a如果存在,a即为在x0处的导数,记作f'(x0)或df(x0)/dx。
- # 不是所有的函数都有导数,一个函数也不一定在所有的点上都有导数。
- # 若某函数在某一点导数存在,则称其在这一点可导,否则称为不可导。然而,可导的函数一定连续;不连续的函数一定不可导。
- def quadraticderivativeplot():
- plt.figure(figsize=(5, 12))
- ax = plt.gca() # 通过gca:get current axis得到当前轴
- plt.rcParams['font.sans-serif'] = ['SimHei'] # 绘图中文
- plt.rcParams['axes.unicode_minus'] = False # 绘图负号
- x = np.linspace(-2, 2, 200)
- y = x ** 2
- label = '函数=x**2的曲线'
- plt.plot(x, y, label=label)
- yd = 2 * x
- label = '导数线=2*x的曲线'
- plt.plot(x, yd, label=label)
- a = 1
- ad = a ** 2
- plt.plot(a, ad, 'og', label='x=1的某个点')
- # y=ax+b,已知a=2,x=1,y=1,求b
- b = ad - 2 * a
- # 准备画切线的数据
- al = np.linspace(-2, 2, 200)
- yl = 2 * al + b
- label = 'x=1的切线'
- plt.plot(al, yl, label=label)
- # 准备画法线的数据,切线斜率=法线斜率的负数
- b = ad + 2 * a
- al = np.linspace(-2, 2, 200)
- yl = -2 * al + b
- label = 'x=1的法线'
- plt.plot(al, yl, label=label)
- # 求导函数
- x = sympy.Symbol('x')
- f1 = x ** 2
- # 参数是函数与变量
- f1_ = sympy.diff(f1, x)
- print(f1_)
- # 设置图片的右边框和上边框为不显示
- ax.spines['right'].set_color('none')
- ax.spines['top'].set_color('none')
- # 挪动x,y轴的位置,也就是图片下边框和左边框的位置
- # data表示通过值来设置x轴的位置,将x轴绑定在y=0的位置
- ax.spines['bottom'].set_position(('data', 0))
- # axes表示以百分比的形式设置轴的位置,即将y轴绑定在x轴50%的位置
- # ax.spines['left'].set_position(('axes', 0.5))
- ax.spines['left'].set_position(('data', 0))
- plt.title("二次函数、导数曲线及某点的法线、切线")
- plt.legend(loc='upper right')
- plt.show()
- # 指数函数的导数
- # 指数函数 y=a**x
- # 指数函数的导数为 y=a**x*ln(a)
- def exponentialderivativeplot():
- plt.figure(figsize=(5, 12))
- ax = plt.gca() # 通过gca:get current axis得到当前轴
- plt.rcParams['font.sans-serif'] = ['SimHei'] # 绘图中文
- plt.rcParams['axes.unicode_minus'] = False # 绘图负号
- a = 2
- x = np.linspace(-2, 2, 200)
- y = np.power(a, x)
- yd = np.power(a, x) * np.log(a)
- label = '函数=a**x的曲线'
- plt.plot(x, y, label=label)
- label = '导数线=a**x的曲线'
- plt.plot(x, yd, label=label)
- xpoint = 1
- ypoint = np.power(a, xpoint)
- plt.plot(xpoint, ypoint, 'og', label='x=1的某个点')
- # 斜率slope=导数,求截距intercept
- slope = math.pow(a, xpoint) * math.log(a, np.e)
- # y=ax+b,已知a,x,y,求b
- intercept = ypoint - slope * xpoint
- # 准备画切线的数据
- yl = x * slope + intercept
- # print(slope,intercept,yl)
- label = 'x=1的切线'
- plt.plot(x, yl, label=label)
- # 准备画法线的数据,切线斜率=法线斜率的负数
- # y=ax+b,已知x,y,-a,求b
- intercept = ypoint + slope * xpoint
- yl = -x * slope + intercept
- label = 'x=1的法线'
- plt.plot(x, yl, label=label)
- # # 求导函数
- # x = sympy.Symbol('x')
- # f1 = x**2
- # # 参数是函数与变量
- # f1_ = sympy.diff(f1, x)
- # print(f1_)
- # 设置图片的右边框和上边框为不显示
- ax.spines['right'].set_color('none')
- ax.spines['top'].set_color('none')
- # 挪动x,y轴的位置,也就是图片下边框和左边框的位置
- # data表示通过值来设置x轴的位置,将x轴绑定在y=0的位置
- ax.spines['bottom'].set_position(('data', 0))
- # axes表示以百分比的形式设置轴的位置,即将y轴绑定在x轴50%的位置
- # ax.spines['left'].set_position(('axes', 0.5))
- ax.spines['left'].set_position(('data', 0))
- plt.title("指数函数、导数曲线及某点的法线、切线")
- plt.legend(loc='upper right')
- plt.show()
- # 常用导数公式表如下:#
- # c'=0(c为常数)
- # (x^a)'=ax^(a-1),a为常数且a≠0
- # (a^x)'=a^xlna
- # (e^x)'=e^x#
- # (logax)'=1/(xlna),a>0且 a≠1
- # (lnx)'=1/x
- # (sinx)'=cosx
- # (cosx)'=-sinx
- # (tanx)'=(secx)^2
- # (secx)'=secxtanx
- # (cotx)'=-(cscx)^2
- # (cscx)'=-csxcotx
- # (arcsinx)'=1/√(1-x^2)
- # (arccosx)'=-1/√(1-x^2)
- # (arctanx)'=1/(1+x^2)
- # (arccotx)'=-1/(1+x^2)
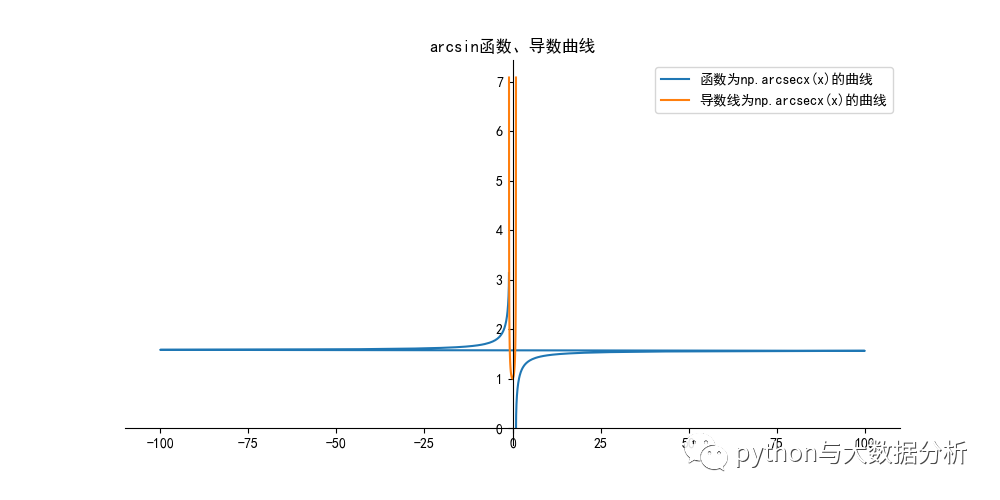
- # arcsinx函数的导数
- # arcsinx函数
- # arcsinx函数的导数为 1/√(1-x^2)
- def arccscderivativeplot():
- plt.figure(figsize=(10, 5))
- ax = plt.gca() # 通过gca:get current axis得到当前轴
- plt.rcParams['font.sans-serif'] = ['SimHei'] # 绘图中文
- plt.rcParams['axes.unicode_minus'] = False # 绘图负号
- x = np.append(np.linspace(0.01, np.pi / 2 - 0.01, 120),
- np.linspace(np.pi / 2 + 0.01, np.pi - 0.01, 120))
- y = 1 / np.cos(x)
- # 正割函数 sec(x)=1/cos(x)
- # 反正割函数 颠倒x,y值即可
- label = '函数为np.arcsecx(x)的曲线'
- plt.plot(y, x, label=label)
- x = np.linspace(-0.99, 0.99, 120)
- yd = 1 / np.sqrt(1 - np.power(x, 2))
- label = '导数线为np.arcsecx(x)的曲线'
- plt.plot(x, yd, label=label)
- # 设置图片的右边框和上边框为不显示
- ax.spines['right'].set_color('none')
- ax.spines['top'].set_color('none')
- # 挪动x,y轴的位置,也就是图片下边框和左边框的位置
- # data表示通过值来设置x轴的位置,将x轴绑定在y=0的位置
- ax.spines['bottom'].set_position(('data', 0))
- # axes表示以百分比的形式设置轴的位置,即将y轴绑定在x轴50%的位置
- # ax.spines['left'].set_position(('axes', 0.5))
- ax.spines['left'].set_position(('data', 0))
- plt.title("arcsin函数、导数曲线")
- plt.legend(loc='upper right')
- plt.show()


