本文转载自微信公众号「python与大数据分析」,作者一只小小鸟鸟。转载本文请联系python与大数据分析公众号。
三角函数在python和numpy中实现的不够全面,主要包括cos, cosh, sin sinh, tan, tanh三角函数和arccos, arccosh, arcsin, arcsinh, arctan, arctanh反三角函数,cot,sec,csc,arccot,arcsec,arccsc均为提供,不过可以通过其他函数进行组合或变形得以实现。
三角函数是基本初等函数之一,是以角度(数学上最常用弧度制,下同)为自变量,角度对应任意角终边与单位圆交点坐标或其比值为因变量的函数。也可以等价地用与单位圆有关的各种线段的长度来定义。三角函数在研究三角形和圆等几何形状的性质时有重要作用,也是研究周期性现象的基础数学工具。在数学分析中,三角函数也被定义为无穷级数或特定微分方程的解,允许它们的取值扩展到任意实数值,甚至是复数值。
反三角函数是一种基本初等函数。它是反正弦arcsin x,反余弦arccos x,反正切arctan x,反余切arccot x,反正割arcsec x,反余割arccsc x这些函数的统称,各自表示其正弦、余弦、正切、余切 ,正割,余割为x的角
#!/usr/bin/env python
# -*- coding: UTF-8 -*-
# _ooOoo_
# o8888888o
# 88" . "88
# ( | - _ - | )
# O\ = /O
# ____/`---'\____
# .' \\| |// `.
# / \\|||:|||// \
# / _|||||-:- |||||- \
# | | \\\ - /// | |
# | \_| ''\---/'' | _/ |
# \ .-\__ `-` ___/-. /
# ___`. .' /--.--\ `. . __
# ."" '< `.___\_<|>_/___.' >'"".
# | | : `- \`.;`\ _ /`;.`/ - ` : | |
# \ \ `-. \_ __\ /__ _/ .-` / /
# ==`-.____`-.___\_____/___.-`____.-'==
# `=---='
'''
@Project :pythonalgorithms
@File :trigonometric.py
@Author :不胜人生一场醉@Date :2021/7/26 23:28
'''
import matplotlib.pyplot as plt
import numpy as np
import math
import mpl_toolkits.axisartist as axisartist # 导入坐标轴加工模块
# 三角函数是基本初等函数之一,是以角度(数学上最常用弧度制,下同)为自变量,角度对应任意角终边与单位圆交点坐标或其比值为因变量的函数。
# 也可以等价地用与单位圆有关的各种线段的长度来定义。三角函数在研究三角形和圆等几何形状的性质时有重要作用,
# 也是研究周期性现象的基础数学工具。
# 在数学分析中,三角函数也被定义为无穷级数或特定微分方程的解,允许它们的取值扩展到任意实数值,甚至是复数值。
# 正弦函数 :y =sin x
# 正弦(sine),数学术语,在直角三角形中,任意一锐角∠A的对边与斜边的比叫做∠A的正弦,记作sinA(由英语sine一词简写得来),即sinA=∠A的对边/斜边。
# 余弦函数 :y =cos x
# 余弦(余弦函数)。在Rt△ABC(直角三角形)中,∠C=90°(如概述图所示),∠A的余弦是它的邻边比三角形的斜边,即cosA=b/c,也可写为cosa=AC/AB。余弦函数:f(x)=cosx(x∈R)
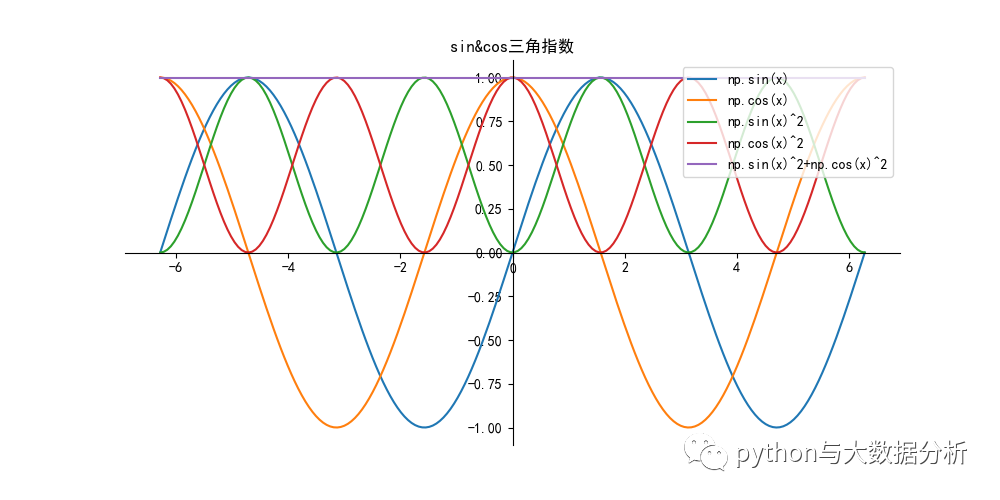
# 平方和关系
# (sinα)^2 +(cosα)^2=1
# 积的关系
# sinα = tanα × cosα(即sinα / cosα = tanα )
# cosα = cotα × sinα (即cosα / sinα = cotα)
# tanα = sinα × secα (即 tanα / sinα = secα)
# 倒数关系
# tanα × cotα = 1
# sinα × cscα = 1
# cosα × secα = 1
# 商的关系
# sinα / cosα = tanα = secα / cscα
# 和角公式
# sin ( α ± β ) = sinα · cosβ ± cosα · sinβ
# sin ( α + β + γ ) = sinα · cosβ · cosγ + cosα · sinβ · cosγ + cosα · cosβ · sinγ - sinα · sinβ · sinγ
# cos ( α ± β ) = cosα cosβ ∓ sinβ sinα
# tan ( α ± β ) = ( tanα ± tanβ ) / ( 1 ∓ tanα tanβ )
# 倍角半角公式
# sin ( 2α ) = 2sinα · cosα [1]
# sin ( 3α ) = 3sinα - 4sin & sup3 ; ( α ) = 4sinα · sin ( 60 + α ) sin ( 60 - α )
# sin ( α / 2 ) = ± √( ( 1 - cosα ) / 2)
# 级数展开
# sin x = x - x3 / 3! + x5 / 5! - ... ( - 1 ) k - 1 * x 2 k - 1 / ( 2k - 1 ) ! + ... ( - ∞ < x < ∞ )
# 导数
# ( sinx ) ' = cosx
# ( cosx ) ' = ﹣ sinx
if __name__ == "__main__":
sincosfunction()
tanctnfunction()
seccscfunction()
arcsincosfunction()
arccscfunction()
- 1.
- 2.
- 3.
- 4.
- 5.
- 6.
- 7.
- 8.
- 9.
- 10.
- 11.
- 12.
- 13.
- 14.
- 15.
- 16.
- 17.
- 18.
- 19.
- 20.
- 21.
- 22.
- 23.
- 24.
- 25.
- 26.
- 27.
- 28.
- 29.
- 30.
- 31.
- 32.
- 33.
- 34.
- 35.
- 36.
- 37.
- 38.
- 39.
- 40.
- 41.
- 42.
- 43.
- 44.
- 45.
- 46.
- 47.
- 48.
- 49.
- 50.
- 51.
- 52.
- 53.
- 54.
- 55.
- 56.
- 57.
- 58.
- 59.
- 60.
- 61.
- 62.
- 63.
- 64.
- 65.
- 66.
- 67.
- 68.
- 69.
- 70.
def sincosfunction():
   plt.figure(figsize=(10, 5))
   ax = plt.gca()  # 通过gca:get current axis得到当前轴
   plt.rcParams['font.sans-serif'] = ['SimHei']  # 绘图中文
   plt.rcParams['axes.unicode_minus'] = False  # 绘图负号
   x = np.linspace(-np.pi*2, np.pi*2, 200)

   y = np.sin(x)
   label = 'np.sin(x)'
   plt.plot(x, y, label=label)
   y = np.cos(x)
   label = 'np.cos(x)'
   plt.plot(x, y, label=label)
   y = np.power(np.sin(x),2)
   label = 'np.sin(x)^2'
   plt.plot(x, y, label=label)
   y = np.power(np.cos(x),2)
   label = 'np.cos(x)^2'
   plt.plot(x, y, label=label)
   y = np.power(np.cos(x), 2)+np.power(np.sin(x),2)
   label = 'np.sin(x)^2+np.cos(x)^2'
   plt.plot(x, y, label=label)

   # 设置图片的右边框和上边框为不显示
   ax.spines['right'].set_color('none')
   ax.spines['top'].set_color('none')

   # 挪动x,y轴的位置,也就是图片下边框和左边框的位置
   # data表示通过值来设置x轴的位置,将x轴绑定在y=0的位置
   ax.spines['bottom'].set_position(('data', 0))
   # axes表示以百分比的形式设置轴的位置,即将y轴绑定在x轴50%的位置
   # ax.spines['left'].set_position(('axes', 0.5))
   ax.spines['left'].set_position(('data', 0))
   plt.title("sin&cos三角指数")
   plt.legend(loc='upper right')
   plt.show()
- 1.
- 2.
- 3.
- 4.
- 5.
- 6.
- 7.
- 8.
- 9.
- 10.
- 11.
- 12.
- 13.
- 14.
- 15.
- 16.
- 17.
- 18.
- 19.
- 20.
- 21.
- 22.
- 23.
- 24.
- 25.
- 26.
- 27.
- 28.
- 29.
- 30.
- 31.
- 32.
- 33.
- 34.
- 35.
- 36.
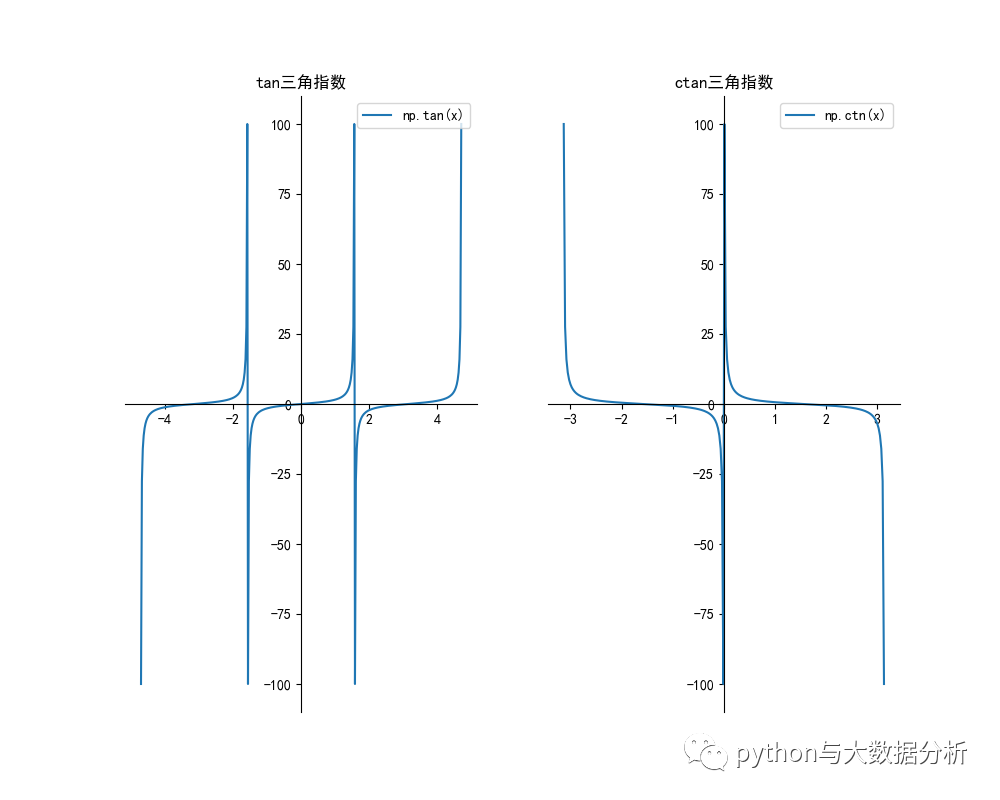
# 正切函数 :y =tan x
# 余切函数 :y =cot x
def tanctnfunction():
   #np.tan()
   plt.figure(figsize=(10, 8))
   plt.subplot(1, 2, 1)
   ax = plt.gca()  # 通过gca:get current axis得到当前轴
   plt.rcParams['font.sans-serif'] = ['SimHei']  # 绘图中文
   plt.rcParams['axes.unicode_minus'] = False  # 绘图负号
   x = np.append(np.linspace(-np.pi*3/2+0.01, -np.pi/2-0.01, 120),np.linspace(-np.pi/2+0.01, np.pi/2-0.01, 120))
   x = np.append(x,np.linspace(np.pi/2+0.01, np.pi*3/2-0.01, 120))
   y = np.tan(x)
   label = 'np.tan(x)'
   plt.plot(x, y, label=label)


   # 设置图片的右边框和上边框为不显示
   ax.spines['right'].set_color('none')
   ax.spines['top'].set_color('none')

   # 挪动x,y轴的位置,也就是图片下边框和左边框的位置
   # data表示通过值来设置x轴的位置,将x轴绑定在y=0的位置
   ax.spines['bottom'].set_position(('data', 0))
   # axes表示以百分比的形式设置轴的位置,即将y轴绑定在x轴50%的位置
   # ax.spines['left'].set_position(('axes', 0.5))
   ax.spines['left'].set_position(('data', 0))
   plt.title("tan三角指数")
   plt.legend(loc='upper right')


   plt.subplot(1, 2, 2)
   ax = plt.gca()  # 通过gca:get current axis得到当前轴
   plt.rcParams['font.sans-serif'] = ['SimHei']  # 绘图中文
   plt.rcParams['axes.unicode_minus'] = False  # 绘图负号
   x = np.append(np.linspace(-np.pi+ 0.01, - 0.01, 120),
              np.linspace( 0.01, np.pi - 0.01, 120))
   y = 1/np.tan(x)
   label = 'np.ctn(x)'
   plt.plot(x, y, label=label)
   # 设置图片的右边框和上边框为不显示
   ax.spines['right'].set_color('none')
   ax.spines['top'].set_color('none')

   # 挪动x,y轴的位置,也就是图片下边框和左边框的位置
   # data表示通过值来设置x轴的位置,将x轴绑定在y=0的位置
   ax.spines['bottom'].set_position(('data', 0))
   # axes表示以百分比的形式设置轴的位置,即将y轴绑定在x轴50%的位置
   ax.spines['left'].set_position(('axes', 0.5))
   #ax.spines['left'].set_position(('data', 0))
   plt.title("ctan三角指数")
   plt.legend(loc='upper right')
   plt.show()
- 1.
- 2.
- 3.
- 4.
- 5.
- 6.
- 7.
- 8.
- 9.
- 10.
- 11.
- 12.
- 13.
- 14.
- 15.
- 16.
- 17.
- 18.
- 19.
- 20.
- 21.
- 22.
- 23.
- 24.
- 25.
- 26.
- 27.
- 28.
- 29.
- 30.
- 31.
- 32.
- 33.
- 34.
- 35.
- 36.
- 37.
- 38.
- 39.
- 40.
- 41.
- 42.
- 43.
- 44.
- 45.
- 46.
- 47.
- 48.
- 49.
- 50.
- 51.
- 52.
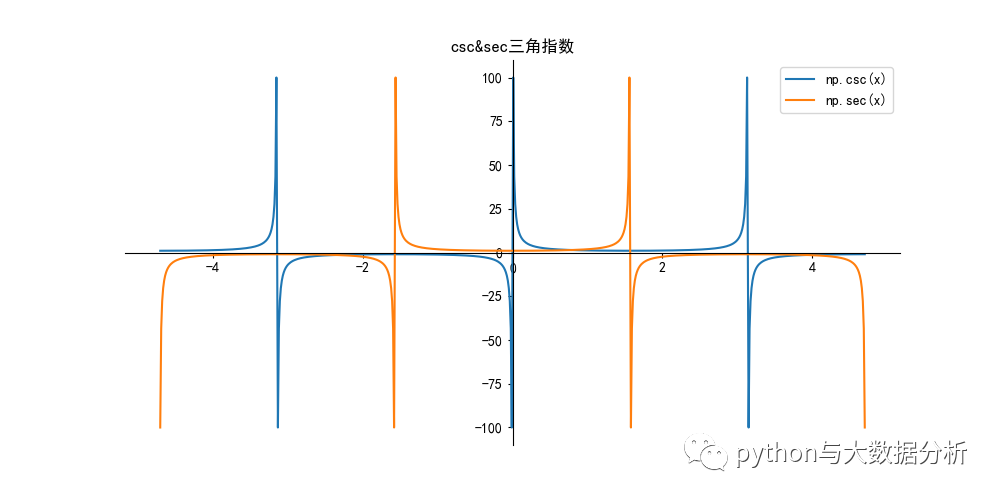
# 正割函数 :y =sec x = 1/cos(x)
# 余割函数 :y =csc x = 1/sin(x)
def seccscfunction():
   plt.figure(figsize=(10, 5))
   ax = plt.gca()  # 通过gca:get current axis得到当前轴
   plt.rcParams['font.sans-serif'] = ['SimHei']  # 绘图中文
   plt.rcParams['axes.unicode_minus'] = False  # 绘图负号
   #x = np.linspace(-np.pi*2, np.pi*2, 200)
   x = np.append(np.linspace(-np.pi * 3 / 2 + 0.01, -np.pi - 0.01, 120),
              np.linspace(-np.pi + 0.01, -np.pi / 2 - 0.01, 120))
   x = np.append(x, np.linspace(-np.pi / 2 + 0.01,  - 0.01, 120))
   x = np.append(x, np.linspace(0.01, np.pi  / 2 - 0.01, 120))
   x = np.append(x, np.linspace(np.pi / 2 + 0.01, np.pi  - 0.01, 120))
   x = np.append(x, np.linspace(np.pi + 0.01, np.pi * 3 / 2 - 0.01, 120))
   y = 1/np.sin(x)
   label = 'np.csc(x)'
   plt.plot(x, y, label=label)
   y = 1/np.cos(x)
   label = 'np.sec(x)'
   plt.plot(x, y, label=label)

   # 设置图片的右边框和上边框为不显示
   ax.spines['right'].set_color('none')
   ax.spines['top'].set_color('none')

   # 挪动x,y轴的位置,也就是图片下边框和左边框的位置
   # data表示通过值来设置x轴的位置,将x轴绑定在y=0的位置
   ax.spines['bottom'].set_position(('data', 0))
   # axes表示以百分比的形式设置轴的位置,即将y轴绑定在x轴50%的位置
   # ax.spines['left'].set_position(('axes', 0.5))
   ax.spines['left'].set_position(('data', 0))
   plt.title("csc&sec三角指数")
   plt.legend(loc='upper right')
   plt.show()
- 1.
- 2.
- 3.
- 4.
- 5.
- 6.
- 7.
- 8.
- 9.
- 10.
- 11.
- 12.
- 13.
- 14.
- 15.
- 16.
- 17.
- 18.
- 19.
- 20.
- 21.
- 22.
- 23.
- 24.
- 25.
- 26.
- 27.
- 28.
- 29.
- 30.
- 31.
- 32.
- 33.
- 34.
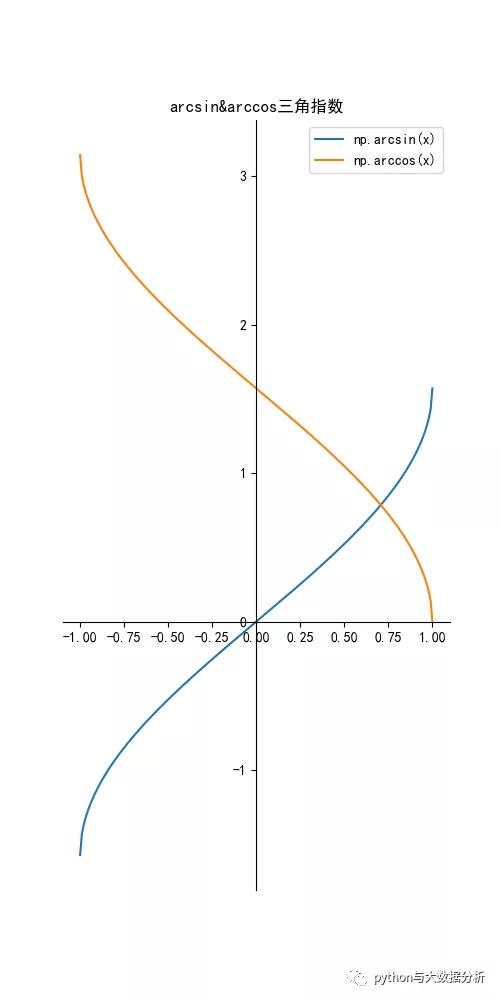
ef arcsincosfunction():
   plt.figure(figsize=(5, 10))
   ax = plt.gca()  # 通过gca:get current axis得到当前轴
   plt.rcParams['font.sans-serif'] = ['SimHei']  # 绘图中文
   plt.rcParams['axes.unicode_minus'] = False  # 绘图负号
   x = np.linspace(-1, 1, 200)

   y = np.arcsin(x)
   label = 'np.arcsin(x)'
   plt.plot(x, y, label=label)
   y = np.arccos(x)
   label = 'np.arccos(x)'
   plt.plot(x, y, label=label)

   # 设置图片的右边框和上边框为不显示
   ax.spines['right'].set_color('none')
   ax.spines['top'].set_color('none')

   # 挪动x,y轴的位置,也就是图片下边框和左边框的位置
   # data表示通过值来设置x轴的位置,将x轴绑定在y=0的位置
   ax.spines['bottom'].set_position(('data', 0))
   # axes表示以百分比的形式设置轴的位置,即将y轴绑定在x轴50%的位置
   # ax.spines['left'].set_position(('axes', 0.5))
   ax.spines['left'].set_position(('data', 0))
   plt.title("arcsin&arccos三角指数")
   plt.legend(loc='upper right')
   plt.show()
- 1.
- 2.
- 3.
- 4.
- 5.
- 6.
- 7.
- 8.
- 9.
- 10.
- 11.
- 12.
- 13.
- 14.
- 15.
- 16.
- 17.
- 18.
- 19.
- 20.
- 21.
- 22.
- 23.
- 24.
- 25.
- 26.
- 27.
# 反正切函数
# 正切函数y=tan x在(-π/2,π/2)上的反函数,叫做反正切函数。记作arctanx,表示一个正切值为x的角,该角的范围在(-π/2,π/2)区间内。
# 定义域R,值域(-π/2,π/2)。
# numpy.arctan()
# 反余切函数
# 余切函数y=cot x在(0,π)上的反函数,叫做反余切函数。记作arccotx,表示一个余切值为x的角,该角的范围在(0,π)区间内。
# 定义域R,值域(0,π)。
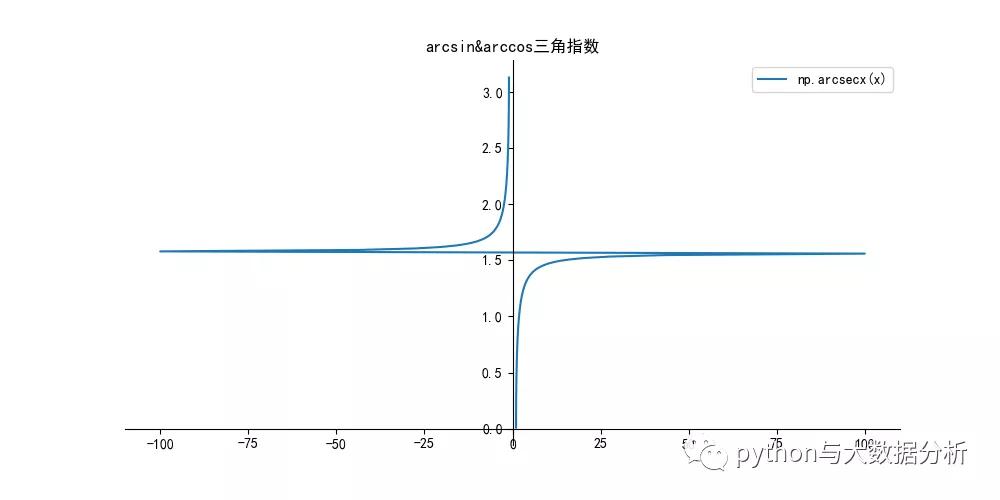
# 反正割函数
# 正割函数 :y =sec x = 1/cos(x)
# 正割函数y=sec x在[0,π/2)U(π/2,π]上的反函数,叫做反正割函数。记作arcsecx,表示一个正割值为x的角,该角的范围在[0,π/2)U(π/2,π]区间内。
# 定义域(-∞,-1]U[1,+∞),值域[0,π/2)U(π/2,π]。
# 反余割函数
# 余割函数 :y =csc x = 1/sin(x)
# 余割函数y=csc x在[-π/2,0)U(0,π/2]上的反函数,叫做反余割函数。记作arccscx,表示一个余割值为x的角,该角的范围在[-π/2,0)U(0,π/2]区间内。
# 定义域(-∞,-1]U[1,+∞),值域[-π/2,0)U(0,π/2]。
def arccscfunction():
plt.figure(figsize=(10, 5))
ax = plt.gca() # 通过gca:get current axis得到当前轴
plt.rcParams['font.sans-serif'] = ['SimHei'] # 绘图中文
plt.rcParams['axes.unicode_minus'] = False # 绘图负号
x = np.append(np.linspace(0.01, np.pi / 2 - 0.01, 120),
np.linspace(np.pi/2+0.01, np.pi - 0.01, 120))
y = 1/np.cos(x)
# 正割函数 sec(x)=1/cos(x)
# 反正割函数 颠倒x,y值即可
label = 'np.arcsecx(x)'
plt.plot(y, x, label=label)
# 设置图片的右边框和上边框为不显示
ax.spines['right'].set_color('none')
ax.spines['top'].set_color('none')
# 挪动x,y轴的位置,也就是图片下边框和左边框的位置
# data表示通过值来设置x轴的位置,将x轴绑定在y=0的位置
ax.spines['bottom'].set_position(('data', 0))
# axes表示以百分比的形式设置轴的位置,即将y轴绑定在x轴50%的位置
# ax.spines['left'].set_position(('axes', 0.5))
ax.spines['left'].set_position(('data', 0))
plt.title("arcsin&arccos三角指数")
plt.legend(loc='upper right')
plt.show()
- 1.
- 2.
- 3.
- 4.
- 5.
- 6.
- 7.
- 8.
- 9.
- 10.
- 11.
- 12.
- 13.
- 14.
- 15.
- 16.
- 17.
- 18.
- 19.
- 20.
- 21.
- 22.
- 23.
- 24.
- 25.
- 26.
- 27.
- 28.
- 29.
- 30.
- 31.
- 32.
- 33.
- 34.
- 35.
- 36.
- 37.
- 38.
- 39.
- 40.
- 41.