本文转载自微信公众号「python与大数据分析」,作者一只小小鸟鸟。转载本文请联系python与大数据分析公众号。
初等函数是由基本初等函数经过有限次的四则运算和复合运算所得到的函数。基本初等函数和初等函数在其定义区间内均为连续函数。高等数学将基本初等函数归为五类:幂函数、指数函数、对数函数、三角函数、反三角函数。
比较头疼的是numpy中的幂函数不支持负数定义域,所以找了很多办法来解决该问题。
主函数代码如下:
- #!/usr/bin/env python
- # -*- coding: UTF-8 -*-
- # _ooOoo_
- # o8888888o
- # 88" . "88
- # ( | - _ - | )
- # O\ = /O
- # ____/`---'\____
- # .' \\| |// `.
- # / \\|||:|||// \
- # / _|||||-:- |||||- \
- # | | \\\ - /// | |
- # | \_| ''\---/'' | _/ |
- # \ .-\__ `-` ___/-. /
- # ___`. .' /--.--\ `. . __
- # ."" '< `.___\_<|>_/___.' >'"".
- # | | : `- \`.;`\ _ /`;.`/ - ` : | |
- # \ \ `-. \_ __\ /__ _/ .-` / /
- # ==`-.____`-.___\_____/___.-`____.-'==
- # `=---='
- '''
- @Project :pythonalgorithms
- @File :basicfunction.py
- @Author :不胜人生一场醉
- @Date :2021/7/19 17:39
- '''
- import matplotlib.pyplot as plt
- import numpy as np
- import math
- import mpl_toolkits.axisartist as axisartist # 导入坐标轴加工模块
- # -----------------函数------------------
- # 给定一个数集A,对A施加一个对应的法则/映射f,记做:f(A),那么可以得到另外一个数集B,也就是可以认为B=f(A);
- # 那么这个关系就叫做函数关系式,简称函数。
- # 三个重要的因素: 定义域A、值域B、对应的映射法则f。
- if __name__ == "__main__":
- # 一次函数
- Linearfunction()
- # 二次函数
- Quadraticfunction()
- # 幂函数
- powerfunction()
- # 指数函数
- exponentialfunction()
- # 对数函数
- Logarithmicfunction()
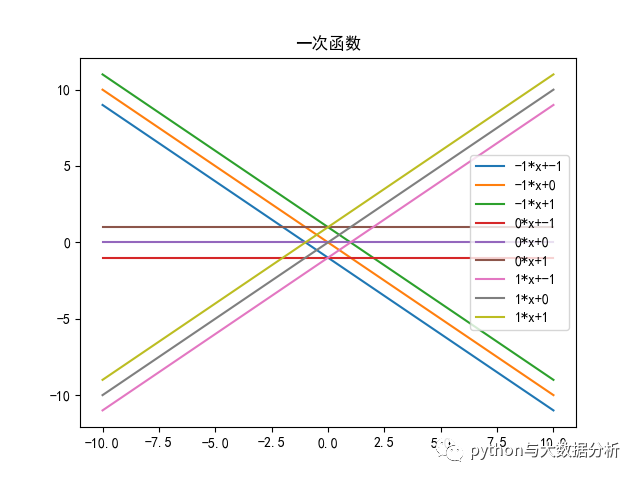
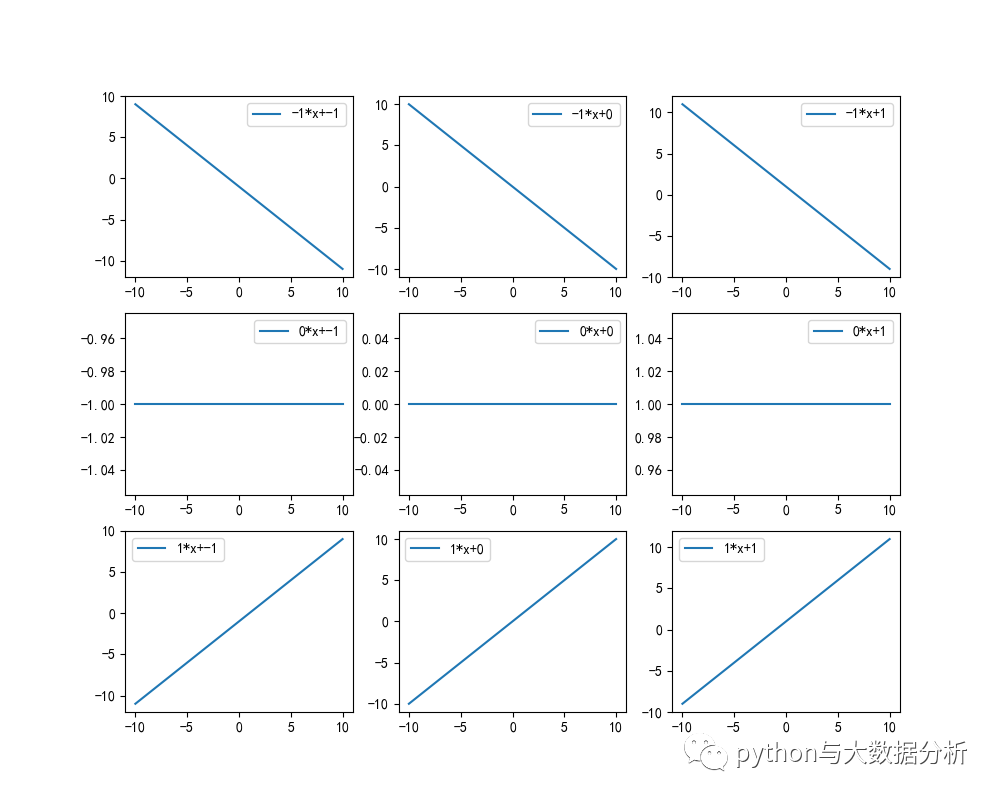
一次函数代码如下:
- # ---------------一次函数------------------
- # 一次函数是函数中的一种,一般形如y=ax+b(a,b是常数,a≠0),其中x是自变量,y是因变量。
- # 当b=0时,y=kx(k为常数,k≠0),y叫做x的正比例函数
- # 当a=0时,y=b,则为常函数
- def Linearfunction():
- fig = plt.figure(figsize=(10, 8))
- plt.rcParams['font.sans-serif'] = ['SimHei'] # 绘图中文
- plt.rcParams['axes.unicode_minus'] = False # 绘图负号
- x = np.linspace(-10, 10, 100)
- i = 1
- alist = [-1, 0, 1]
- blist = [-1, 0, 1]
- for a in alist:
- for b in blist:
- plt.subplot(3, 3, i)
- y = x * a + b
- label = '{}*x+{}'.format(a, b)
- plt.plot(x, y, label=label)
- plt.legend()
- i += 1
- plt.show()
- for a in alist:
- for b in blist:
- y = x * a + b
- label = '{}*x+{}'.format(a, b)
- plt.plot(x, y, label=label)
- i += 1
- plt.title("一次函数")
- plt.legend()
- plt.show()
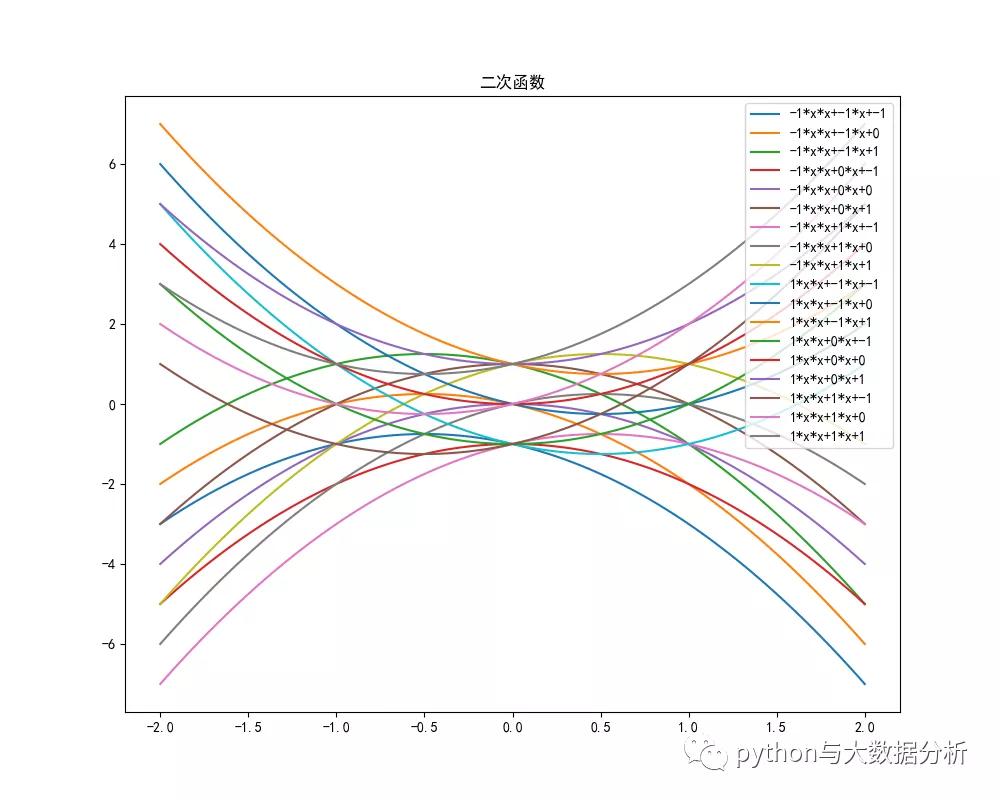
二次函数代码如下:
- # 二次函数(quadratic function)的基本表示形式为y=ax²+bx+c(a≠0)。
- # 二次函数最高次必须为二次, 二次函数的图像是一条对称轴与y轴平行或重合于y轴的抛物线。
- # 其中a称为二次项系数,b为一次项系数,c为常数项。x为自变量,y为因变量。等号右边自变量的最高次数是2。
- # 如果令y值等于零,则可得一个二次方程。该方程的解称为方程的根或函数的零点。
- # 顶点坐标 = (-b/2a,(4ac-b²)/4a
- def Quadraticfunction():
- fig = plt.figure(figsize=(10, 8))
- plt.rcParams['font.sans-serif'] = ['SimHei'] # 绘图中文
- plt.rcParams['axes.unicode_minus'] = False # 绘图负号
- x = np.linspace(-2, 2, 100)
- alist = [-1, 1]
- blist = [-1, 0, 1]
- clist = [-1, 0, 1]
- for a in alist:
- for b in blist:
- for c in clist:
- y = a * x * x + b * x + c
- label = '{}*x*x+{}*x+{}'.format(a, b, c)
- plt.plot(x, y, label=label)
- plt.title("二次函数")
- plt.legend()
- plt.show()
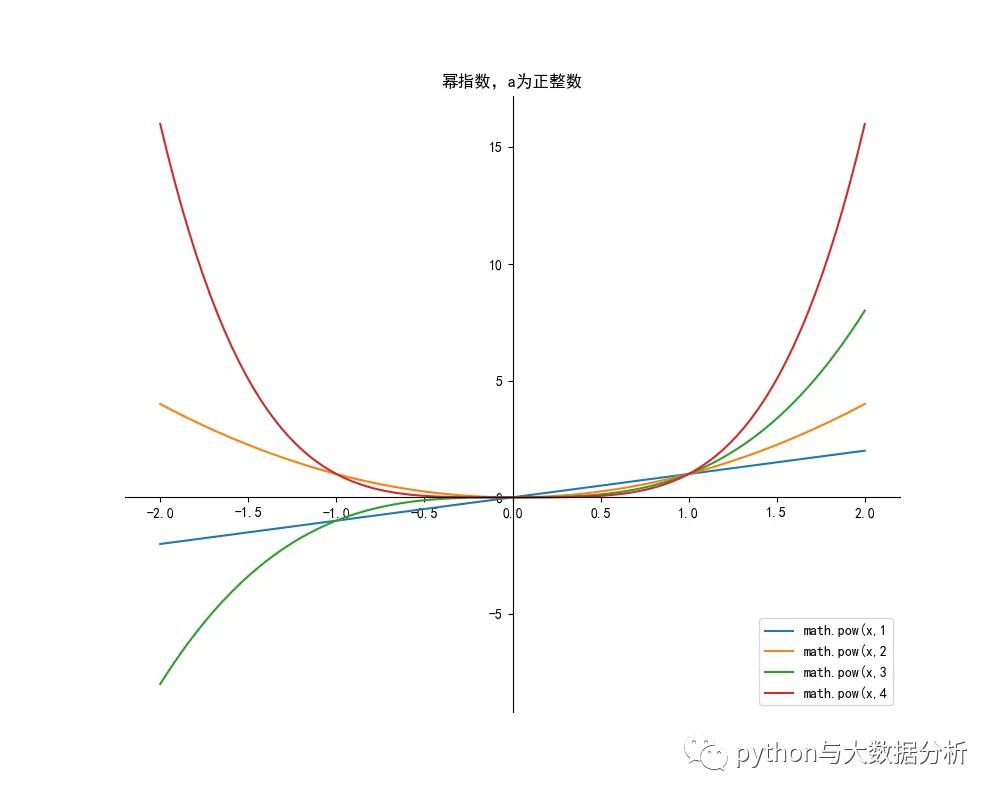
幂函数代码如下:
- # 幂函数是基本初等函数之一。
- # 一般地,y=xα(α为有理数)的函数,即以底数为自变量,幂为因变量,指数为常数的函数称为幂函数。
- # 例如函数y=x0 、y=x、y=x²、y=x³。
- # a = 正数
- # a 为>0 的自然数 x定义域(-∞,∞)
- # a 为<0 的整数 X定义域(-∞,0),(0,∞)
- #
- # a >0 的分数
- # a=n/m m为奇数,n为偶数,x定义域(-∞,∞),y定义域[0,+∞)
- # a=n/m m为奇数,n为奇数,x定义域(-∞,∞),y定义域(-∞,∞)
- # a=n/m m为偶数,n不限,x定义域[0,∞),y定义域[0,+∞)
- #
- # a <0 的分数
- # a=n/m m为奇数,n为偶数,x定义域(-∞,0),(0,∞),y定义域(0,+∞)
- # a=n/m m为奇数,n为奇数,x定义域(-∞,0),(0,∞),y定义域(-∞,0),(0,∞)
- # a=n/m m为偶数,n不限,x定义域(0,∞),y定义域(0,+∞)
- def powerfunction():
- plt.figure(figsize=(10, 8))
- ax = plt.gca() # 通过gca:get current axis得到当前轴
- plt.rcParams['font.sans-serif'] = ['SimHei'] # 绘图中文
- plt.rcParams['axes.unicode_minus'] = False # 绘图负号
- x = np.linspace(-2, 2, 100)
- alist = [1, 2, 3, 4]
- for a in alist:
- y = np.power(x, a)
- label = 'math.pow(x,{}'.format(a)
- plt.plot(x, y, label=label)
- # 设置图片的右边框和上边框为不显示
- ax.spines['right'].set_color('none')
- ax.spines['top'].set_color('none')
- # 挪动x,y轴的位置,也就是图片下边框和左边框的位置
- # data表示通过值来设置x轴的位置,将x轴绑定在y=0的位置
- ax.spines['bottom'].set_position(('data', 0))
- # axes表示以百分比的形式设置轴的位置,即将y轴绑定在x轴50%的位置
- # ax.spines['left'].set_position(('axes', 0.5))
- ax.spines['left'].set_position(('data', 0))
- plt.title("幂指数,a为正整数")
- plt.legend()
- plt.show()
- plt.figure(figsize=(10, 8))
- ax = plt.gca() # 通过gca:get current axis得到当前轴
- plt.rcParams['font.sans-serif'] = ['SimHei'] # 绘图中文
- plt.rcParams['axes.unicode_minus'] = False # 绘图负号
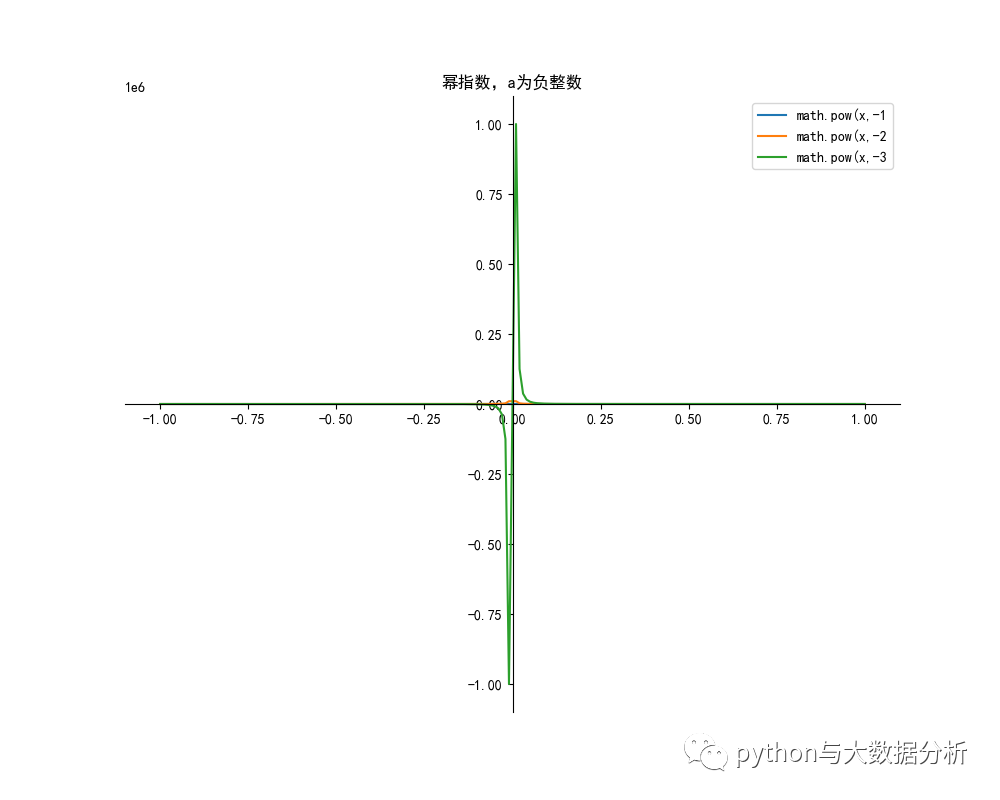
- x = np.append(np.linspace(-1, -0.01, 100), np.linspace(0.01, 1, 100))
- alist = [-1, -2, -3]
- for a in alist:
- y = np.power(x, a)
- label = 'math.pow(x,{}'.format(a)
- plt.plot(x, y, label=label)
- # 设置图片的右边框和上边框为不显示
- ax.spines['right'].set_color('none')
- ax.spines['top'].set_color('none')
- # 挪动x,y轴的位置,也就是图片下边框和左边框的位置
- # data表示通过值来设置x轴的位置,将x轴绑定在y=0的位置
- ax.spines['bottom'].set_position(('data', 0))
- # axes表示以百分比的形式设置轴的位置,即将y轴绑定在x轴50%的位置
- # ax.spines['left'].set_position(('axes', 0.5))
- ax.spines['left'].set_position(('data', 0))
- plt.title("幂指数,a为负整数")
- plt.legend()
- plt.show()
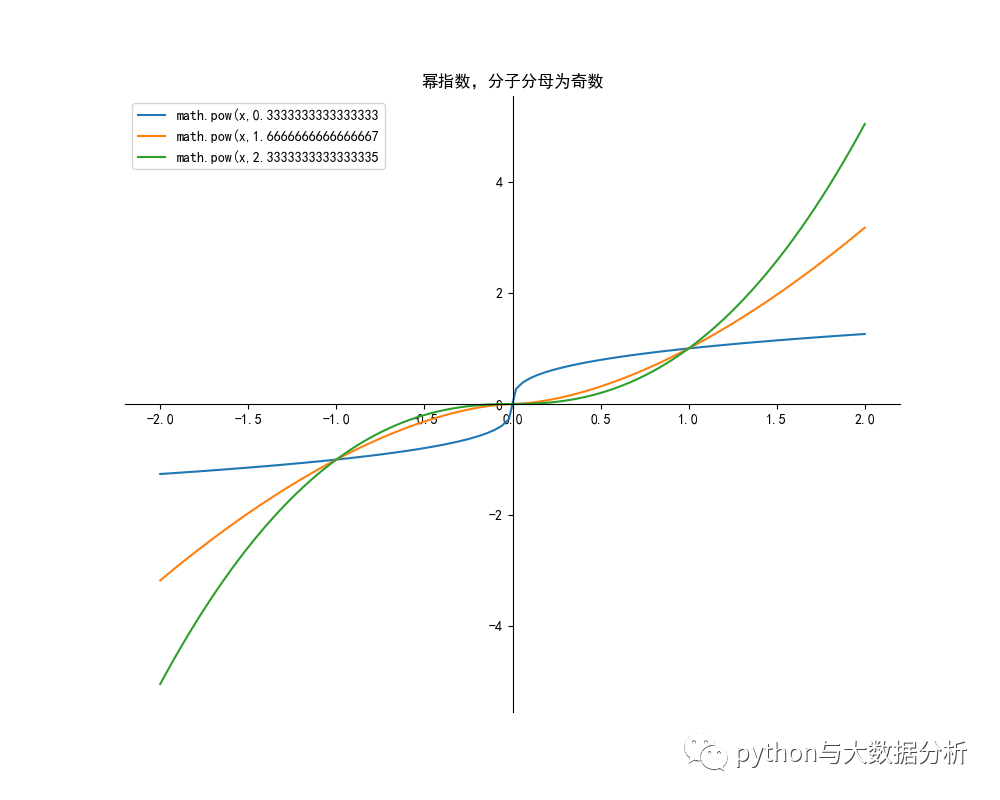
- # a >0 的分数
- # a=n/m m为奇数,n为奇数,x定义域(-∞,∞),y定义域(-∞,∞) 4/3
- # a=n/m m为奇数,n为偶数,x定义域[0,+∞),y定义域[0,+∞)4/3
- # a=n/m m为偶数,n不限,x定义域(-∞,∞),y定义域[0,+∞) 1/2,3/2
- plt.figure(figsize=(10, 8))
- ax = plt.gca() # 通过gca:get current axis得到当前轴
- plt.rcParams['font.sans-serif'] = ['SimHei'] # 绘图中文
- plt.rcParams['axes.unicode_minus'] = False # 绘图负号
- x = np.linspace(-2, 2, 100)
- alist = [1 / 3, 5 / 3, 7 / 3]
- for a in alist:
- # y = np.power(x, a)
- # RuntimeWarning: invalid value encountered in power
- y = np.float_power(abs(x), a) * np.sign(x)
- label = 'math.pow(x,{}'.format(a)
- plt.plot(x, y, label=label)
- # 设置图片的右边框和上边框为不显示
- ax.spines['right'].set_color('none')
- ax.spines['top'].set_color('none')
- # 挪动x,y轴的位置,也就是图片下边框和左边框的位置
- # data表示通过值来设置x轴的位置,将x轴绑定在y=0的位置
- ax.spines['bottom'].set_position(('data', 0))
- # axes表示以百分比的形式设置轴的位置,即将y轴绑定在x轴50%的位置
- # ax.spines['left'].set_position(('axes', 0.5))
- ax.spines['left'].set_position(('data', 0))
- plt.title("幂指数,分子分母为奇数")
- plt.legend()
- plt.show()
- plt.figure(figsize=(10, 8))
- ax = plt.gca() # 通过gca:get current axis得到当前轴
- plt.rcParams['font.sans-serif'] = ['SimHei'] # 绘图中文
- plt.rcParams['axes.unicode_minus'] = False # 绘图负号
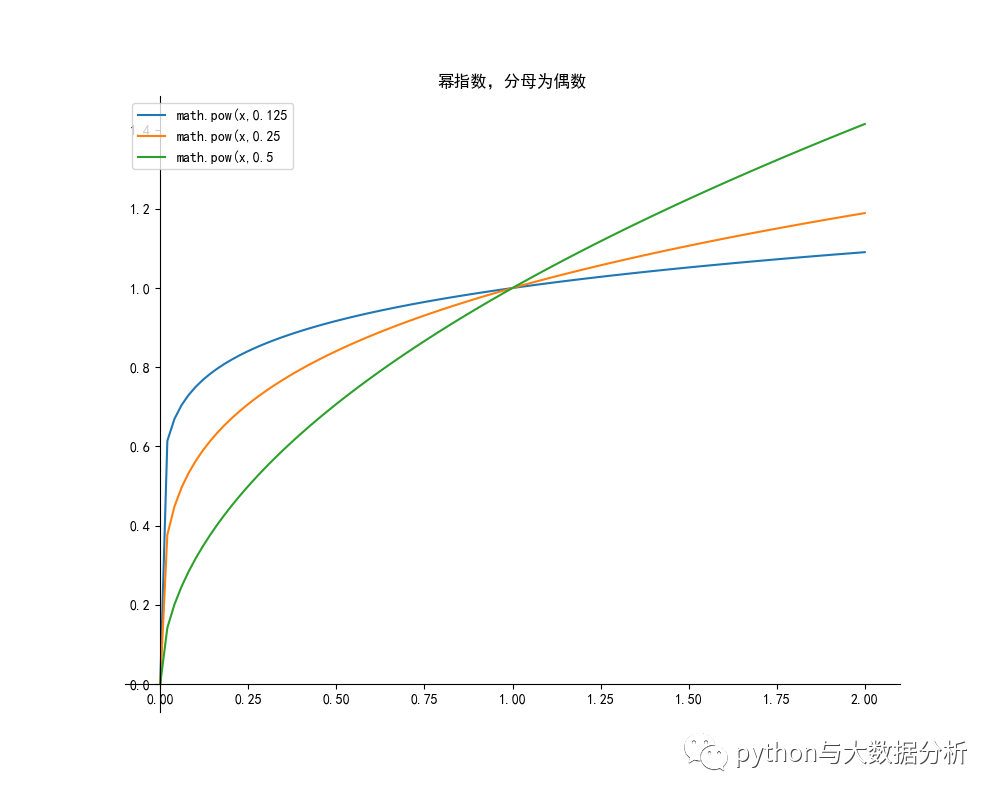
- x = np.linspace(0, 2, 100)
- alist = [1 / 8, 1 / 4, 1 / 2]
- for a in alist:
- y = np.power(x, a)
- # y = np.float_power(abs(x), a) * np.sign(x)
- label = 'math.pow(x,{}'.format(a)
- plt.plot(x, y, label=label)
- # 设置图片的右边框和上边框为不显示
- ax.spines['right'].set_color('none')
- ax.spines['top'].set_color('none')
- # 挪动x,y轴的位置,也就是图片下边框和左边框的位置
- # data表示通过值来设置x轴的位置,将x轴绑定在y=0的位置
- ax.spines['bottom'].set_position(('data', 0))
- # axes表示以百分比的形式设置轴的位置,即将y轴绑定在x轴50%的位置
- # ax.spines['left'].set_position(('axes', 0.5))
- ax.spines['left'].set_position(('data', 0))
- plt.title("幂指数,分母为偶数")
- plt.legend()
- plt.show()
- plt.figure(figsize=(10, 8))
- ax = plt.gca() # 通过gca:get current axis得到当前轴
- plt.rcParams['font.sans-serif'] = ['SimHei'] # 绘图中文
- plt.rcParams['axes.unicode_minus'] = False # 绘图负号
- x = np.linspace(-2, 2, 100)
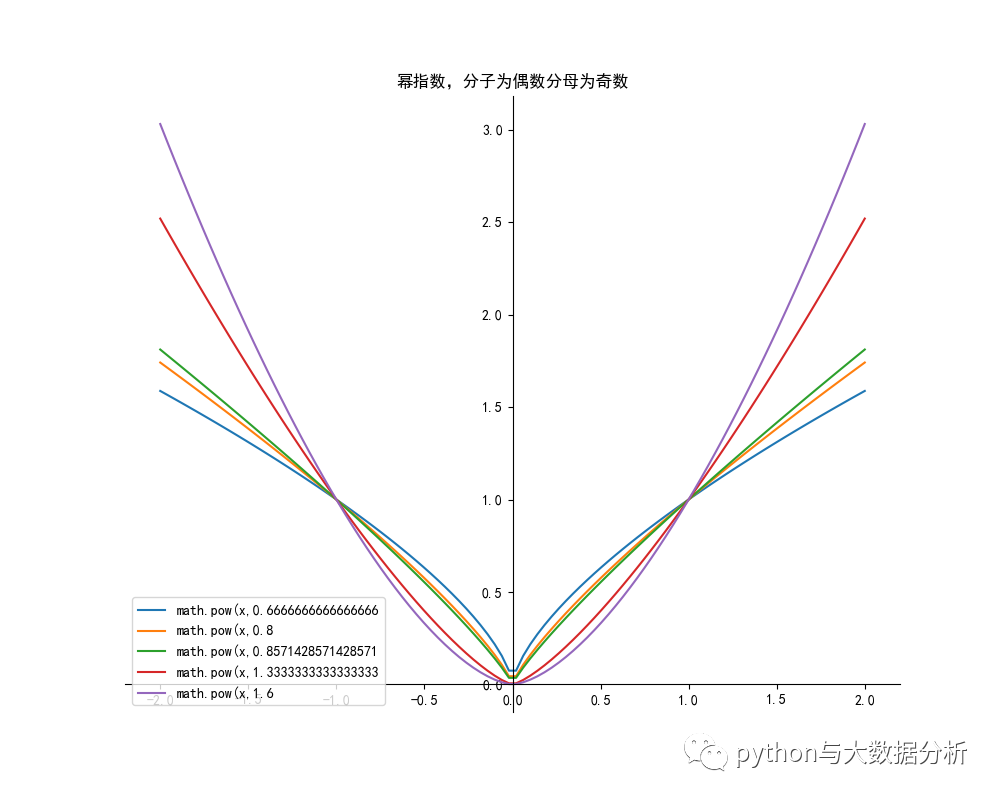
- alist = [2 / 3, 4 / 5, 6 / 7, 4 / 3, 8 / 5]
- for a in alist:
- y = np.power(abs(x), a)
- label = 'math.pow(x,{}'.format(a)
- plt.plot(x, y, label=label)
- # 设置图片的右边框和上边框为不显示
- ax.spines['right'].set_color('none')
- ax.spines['top'].set_color('none')
- # 挪动x,y轴的位置,也就是图片下边框和左边框的位置
- # data表示通过值来设置x轴的位置,将x轴绑定在y=0的位置
- ax.spines['bottom'].set_position(('data', 0))
- # axes表示以百分比的形式设置轴的位置,即将y轴绑定在x轴50%的位置
- # ax.spines['left'].set_position(('axes', 0.5))
- ax.spines['left'].set_position(('data', 0))
- plt.title("幂指数,分子为偶数分母为奇数")
- plt.legend()
- plt.show()
- # 关于负数就不再重复叙述了
- # a <0 的分数
- # a=n/m m为奇数,x定义域(-∞,0),(0,∞),y定义域(0,+∞)
- # a=n/m m为偶数,x定义域(-∞,0),(0,∞),y定义域(-∞,0),(0,∞)
- # a=n/m m为偶数,n为不限,x定义域(0,∞),y定义域(0,+∞)
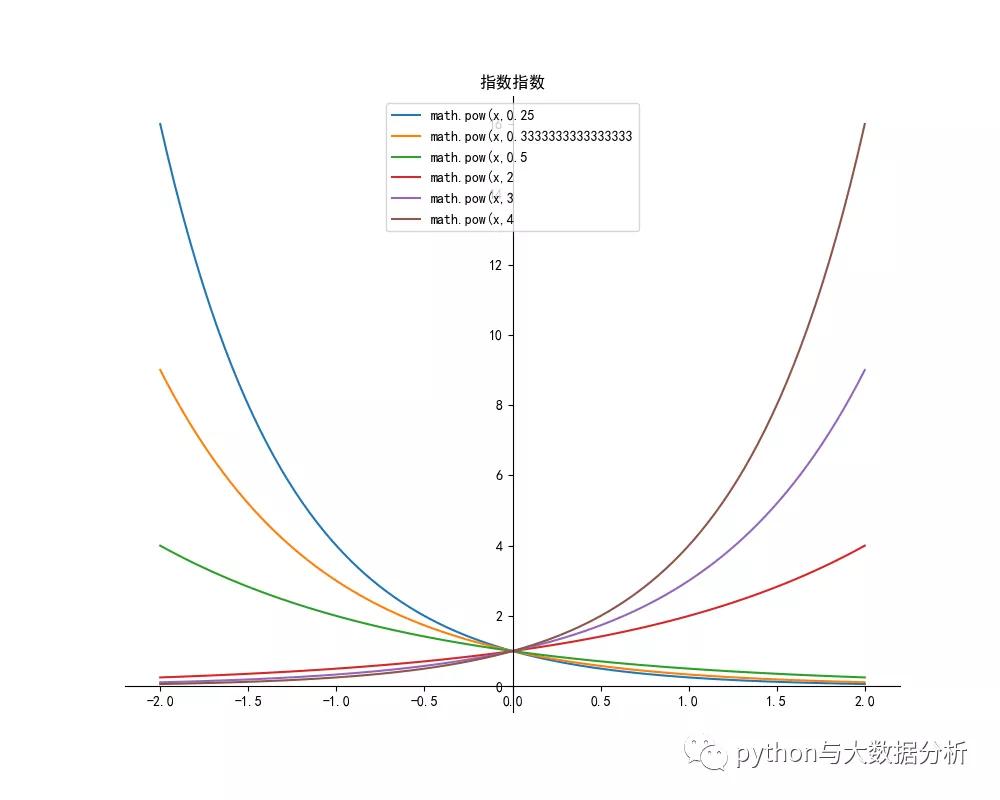
指数函数代码如下:
- # 指数函数是重要的基本初等函数之一。
- # 一般地,y=ax函数(a为常数且以a>0,a≠1)叫做指数函数,函数的定义域是 R 。 [1]
- # 注意,在指数函数的定义表达式中,在ax前的系数必须是数1,自变量x必须在指数的位置上,且不能是x的其他表达式,
- # 否则,就不是指数函数
- def exponentialfunction():
- plt.figure(figsize=(10, 8))
- ax = plt.gca() # 通过gca:get current axis得到当前轴
- plt.rcParams['font.sans-serif'] = ['SimHei'] # 绘图中文
- plt.rcParams['axes.unicode_minus'] = False # 绘图负号
- # a>0 a!=1
- # 定义域为((-∞,∞),值域为(0, +∞),都通过(0, 1)点
- x = np.linspace(-2, 2, 100)
- alist = [1 / 4, 1 / 3, 1 / 2, 2, 3, 4]
- for a in alist:
- y = np.power(a, x)
- label = 'math.pow(x,{}'.format(a)
- plt.plot(x, y, label=label)
- # 设置图片的右边框和上边框为不显示
- ax.spines['right'].set_color('none')
- ax.spines['top'].set_color('none')
- # 挪动x,y轴的位置,也就是图片下边框和左边框的位置
- # data表示通过值来设置x轴的位置,将x轴绑定在y=0的位置
- ax.spines['bottom'].set_position(('data', 0))
- # axes表示以百分比的形式设置轴的位置,即将y轴绑定在x轴50%的位置
- # ax.spines['left'].set_position(('axes', 0.5))
- ax.spines['left'].set_position(('data', 0))
- plt.title("指数指数")
- plt.legend()
- plt.show()
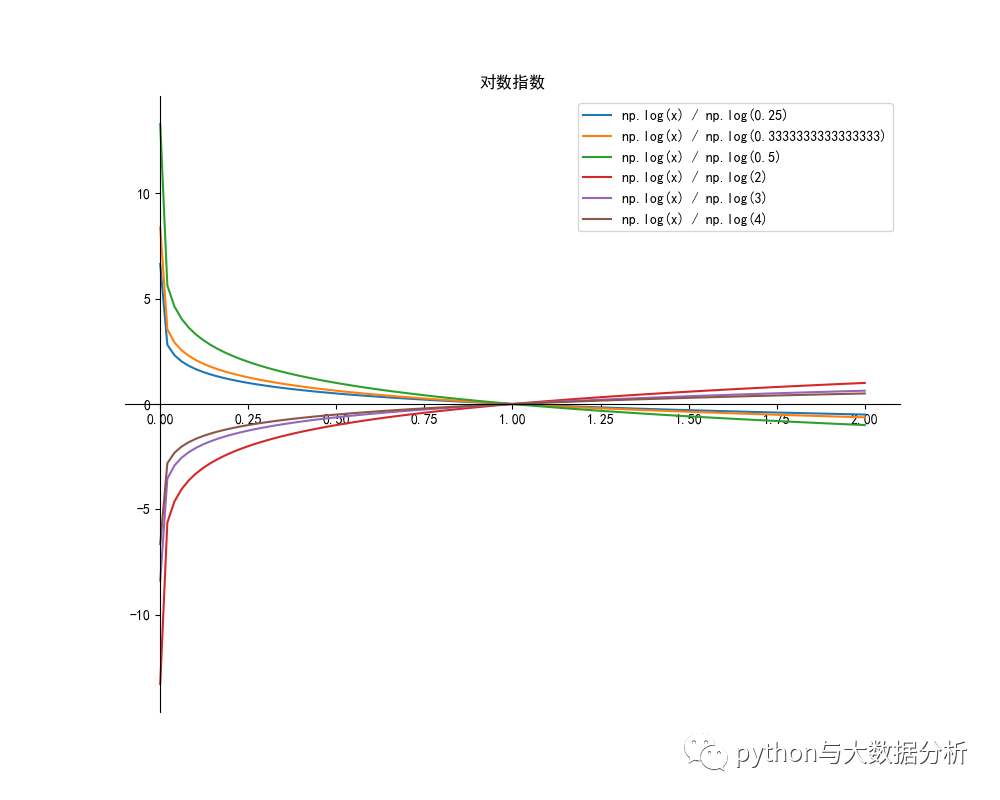
对数函数代码如下:
- # 一般地,对数函数是以幂(真数)为自变量,指数为因变量,底数为常量的函数。
- # 对数函数是6类基本初等函数之一。其中对数的定义:
- # 如果ax =N(a>0,且a≠1),那么数x叫做以a为底N的对数,记作x=logaN,读作以a为底N的对数,其中a叫做对数的底数,N叫做真数。
- # 一般地,函数y=logaX(a>0,且a≠1)叫做对数函数,也就是说以幂(真数)为自变量,指数为因变量,底数为常量的函数,叫对数函数。
- # 其中x是自变量,函数的定义域是(0,+∞),即x>0。它实际上就是指数函数的反函数,可表示为x=ay。因此指数函数里对于a的规定,同样适用于对数函数。
- def Logarithmicfunction():
- plt.figure(figsize=(10, 8))
- ax = plt.gca() # 通过gca:get current axis得到当前轴
- plt.rcParams['font.sans-serif'] = ['SimHei'] # 绘图中文
- plt.rcParams['axes.unicode_minus'] = False # 绘图负号
- # a>0 a!=1
- # 定义域为((-∞,∞),值域为(0, +∞),都通过(0, 1)点
- # 当a>1时,单调递增
- # 当0<a<1时,单调递减
- x = np.linspace(0.0001, 2, 100)
- alist = [1 / 4, 1 / 3, 1 / 2, 2, 3, 4]
- for a in alist:
- y = np.log(x) / np.log(a)
- label = 'np.log(x) / np.log({})'.format(a)
- plt.plot(x, y, label=label)
- # 设置图片的右边框和上边框为不显示
- ax.spines['right'].set_color('none')
- ax.spines['top'].set_color('none')
- # 挪动x,y轴的位置,也就是图片下边框和左边框的位置
- # data表示通过值来设置x轴的位置,将x轴绑定在y=0的位置
- ax.spines['bottom'].set_position(('data', 0))
- # axes表示以百分比的形式设置轴的位置,即将y轴绑定在x轴50%的位置
- # ax.spines['left'].set_position(('axes', 0.5))
- ax.spines['left'].set_position(('data', 0))
- plt.title("对数指数")
- plt.legend()
- plt.show()


