本文转载自微信公众号「架构技术漫谈」,作者LA0WAN9。转载本文请联系架构技术漫谈公众号。
对于大多数 Gopher 而言,一般平时最主要的工作内容除了实现各种无聊的业务逻辑之外,剩下的就是解决各种琐碎的问题。比如:查询性能瓶颈在哪里?查询内存泄漏在哪里?好在 pprof 是处理此类问题的利器,共有两套标准库,分别适用于不同的场景:
- runtime/pprof[1]:采集工具型应用运行数据进行分析
- net/http/pprof[2]:采集服务型应用运行时数据进行分析
命令行工具「go test」就包含了 runtime/pprof,相关参数请参考「go help testflag」:
- shell> go test -cpuprofile cpu.out -memprofile mem.out -bench .
不过和 runtime/pprof 相比,更常用的是 net/http/pprof,接下来我们主要通过它来解决一些常见问题,想要激活 net/http/pprof 的话很简单,只要导入对应的包并启动服务即可:
- import _ "net/http/pprof"
- func main() {
- _ = http.ListenAndServe("localhost:6060", nil)
- }
需要注意的是,千万别让外网访问到 pprof,否则可能会导致出现安全问题。有兴趣的读者可以尝试通过 google 搜索「intitle:/debug/pprof/ inurl:/debug/pprof/」看看反面例子。
Profile
pprof 预置了很多种不同类型的 profile,我们可以按照自己的需要选择:
- allocs:A sampling of all past memory allocations
- block:Stack traces that led to blocking on synchronization primitives
- goroutine:Stack traces of all current goroutines
- heap:A sampling of memory allocations of live objects
- mutex:Stack traces of holders of contended mutexes
- profile:CPU profile
- threadcreate:Stack traces that led to the creation of new OS threads
其中最常用的是 profile 和 heap,分别用来诊断 CPU 和内存问题。
CPU profiling
演示代码模拟了 CPU 密集型任务(onCPU)和耗时的网络请求(offCPU):
- package main
- import (
- "log"
- "net/http"
- _ "net/http/pprof"
- "runtime"
- "time"
- "github.com/felixge/fgprof"
- )
- const cpuTime = 1000 * time.Millisecond
- func main() {
- runtime.SetBlockProfileRate(1)
- runtime.SetMutexProfileFraction(1)
- go func() {
- http.Handle("/debug/fgprof", fgprof.Handler())
- log.Println(http.ListenAndServe(":6060", nil))
- }()
- for {
- cpuIntensiveTask()
- slowNetworkRequest()
- }
- }
- func cpuIntensiveTask() {
- start := time.Now()
- for time.Since(start) <= cpuTime {
- for i := 0; i < 1000; i++ {
- _ = i
- }
- }
- }
- func slowNetworkRequest() {
- resp, err := http.Get("http://httpbin.org/delay/1")
- if err != nil {
- log.Fatal(err)
- }
- defer resp.Body.Close()
- }
通过 go tool pprof 查看 /debug/pprof/profile:
- go tool pprof -http :8080 http://localhost:6060/debug/pprof/profile
结果发现 profile 只能检测到 onCPU(也就是 cpuIntensiveTask)部分,却不能检测到 offCPU (也就是 slowNetworkRequest)部分:
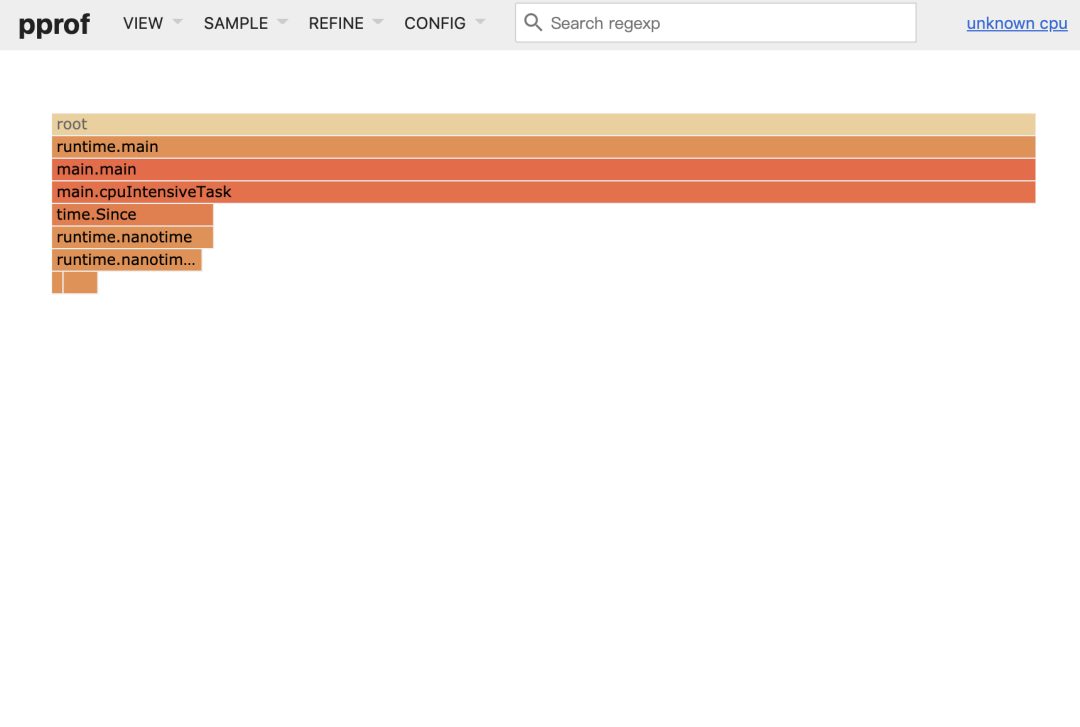
profile
为了检测 offCPU 部分,我们引入 fgprof,通过 go tool pprof 查看 /debug/fgprof:
- go tool pprof -http :8080 http://localhost:6060/debug/fgprof
结果发现 fgprof 不仅能检测到 onCPU(也就是 cpuIntensiveTask)部分,还能检测到 offCPU (也就是 slowNetworkRequest)部分:
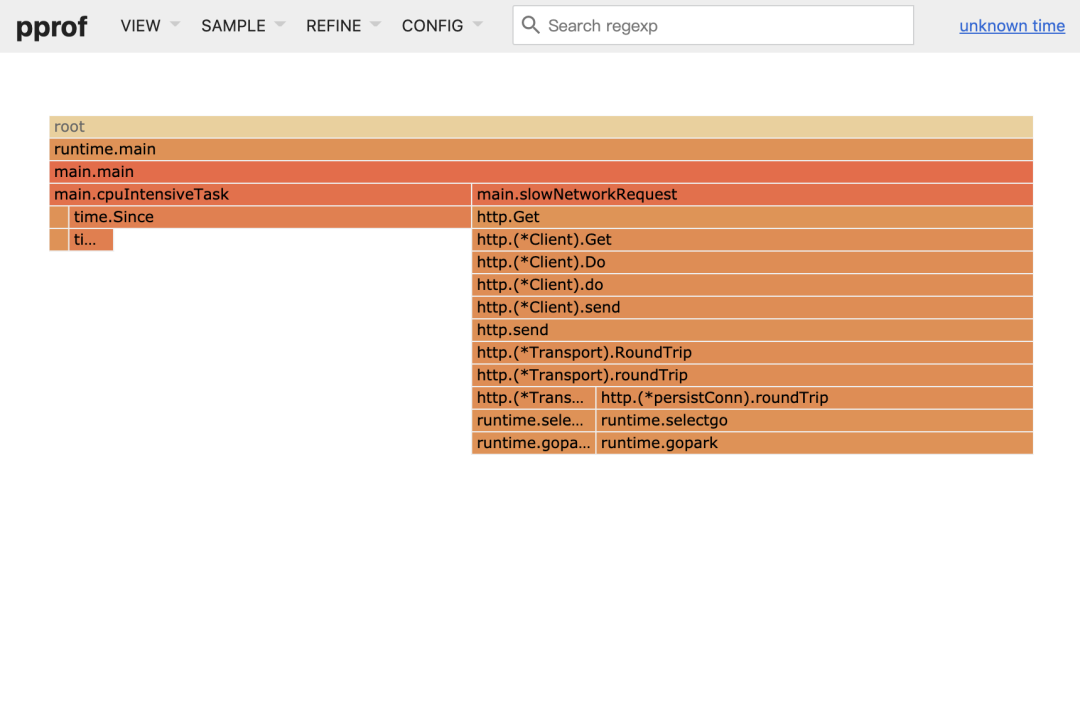
fgprof
实际应用中,最好对你的瓶颈是 onCPU 还是 offCPU 有一个大体的认识,进而选择合适的工具,如果不确定就直接用 fgprof,不过需要注意的是 fgprof 对性能的影响较大。
Memory profiling
演示代码模拟了一段有内存泄漏问题的程序:
- package main
- import (
- "log"
- "net/http"
- _ "net/http/pprof"
- "time"
- )
- func main() {
- go func() {
- log.Println(http.ListenAndServe(":6060", nil))
- }()
- for {
- leak()
- }
- }
- func leak() {
- s := make([]string, 10)
- for i := 0; i < 10000000; i++ {
- s = append(s, "leak")
- if (i % 10000) == 0 {
- time.Sleep(1 * time.Second)
- }
- _ = s
- }
- }
通过 go tool pprof 查看 /debug/pprof/head(这次不用 web,用命令行):
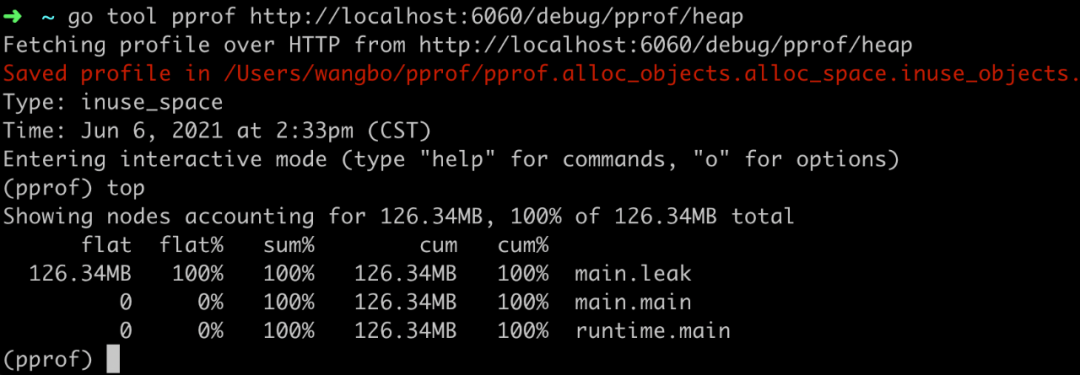
heap
通过 top 命令可以很直观的看出哪里可能出现了内存泄漏问题。不过这里有一个需要说明的问题是内存占用大的地方本身可能是正常的,与内存的绝对值大小相比,我们更应该关注的是不同时间点内存相对变化大小,这里可以使用参数 base 或者 diff_base:
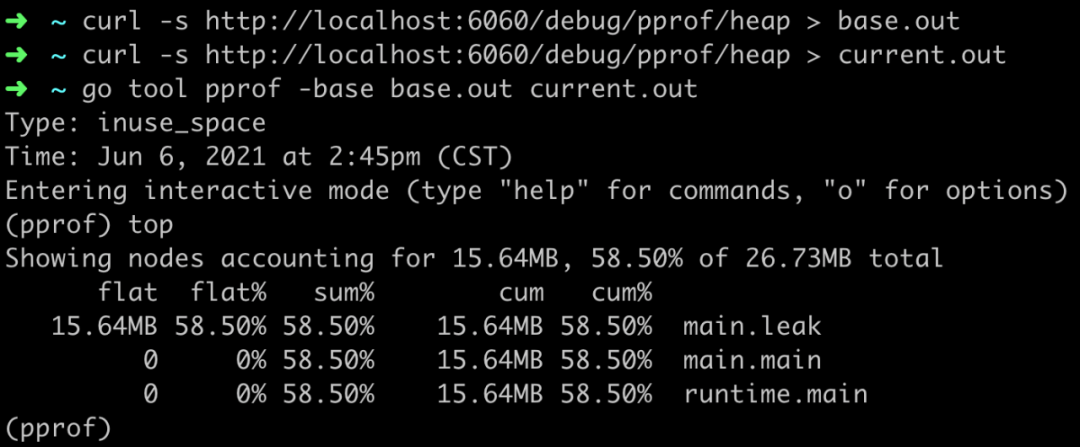
heap
本文篇幅有限,无法列举更多的例子,有兴趣的读者推荐参考「golang pprof 实战[3]」。
参考资料
[1]runtime/pprof: https://golang.org/pkg/runtime/pprof/
[2]net/http/pprof: https://golang.org/pkg/net/http/pprof/
[3]golang pprof 实战: https://blog.wolfogre.com/posts/go-ppof-practice/