1 简介
学习Dash中渲染网页静态表格的常用方法,并在最后的例子中教大家如何配合Dash,简简单单编写一个数据库查询应用~ 还特意在文末藏了惊喜哦!
2 在Dash中渲染静态表格
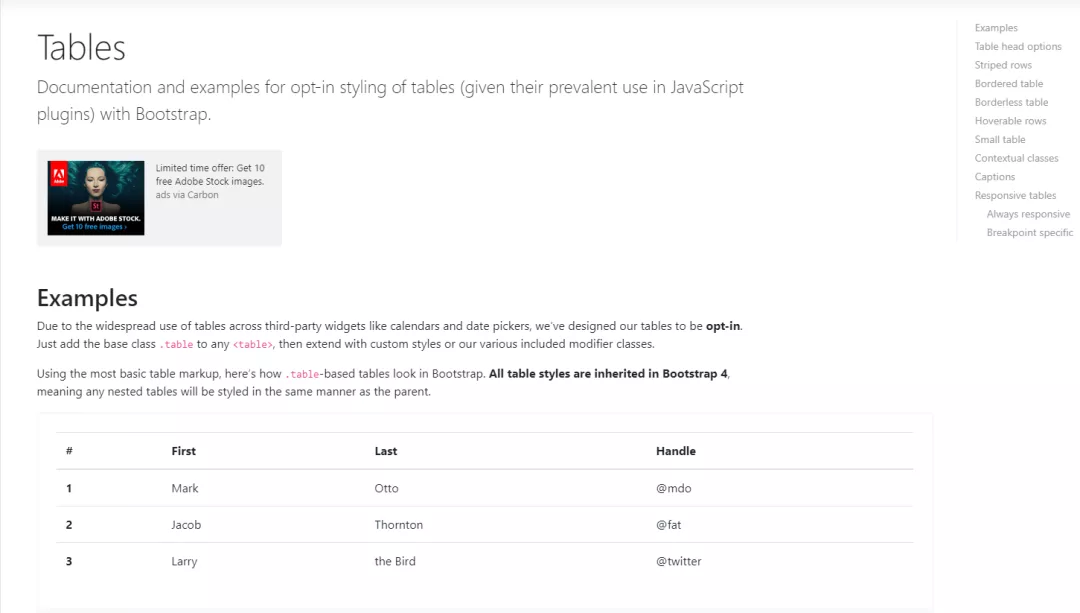
在Dash中渲染「静态」表格,方法有很多,而我们今天要学习的方法,是配合之前文章介绍过的第三方拓展dash_bootstrap_components中的Table()部件,借助bootstrap的特性来快速创建美观的「静态」表格:
2.1 静态表格的构成
要学习如何基于Dash在前端中渲染出一张静态表格,首先我们需要学习其元素构成,Dash延续html中table标签相关概念,由Table()、Thead()、Tbody()、Tr()、Th()以及Td()等6个部件来构成一张完整的表,先从一个简单的例子出发:
❝app1.py❞
- import dash
- import dash_html_components as html
- import dash_bootstrap_components as dbc
- app = dash.Dash(__name__)
- app.layout = html.Div(
- dbc.Container(
- dbc.Table(
- [
- html.Thead(
- html.Tr(
- [
- html.Th('第一列'),
- html.Th('第二列'),
- ]
- )
- ),
- html.Tbody(
- [
- html.Tr(
- [
- html.Td('一行一列'),
- html.Td('一行二列'),
- ]
- ),
- html.Tr(
- [
- html.Td('二行一列'),
- html.Td('二行二列'),
- ]
- )
- ]
- )
- ]
- ),
- style={
- 'margin-top': '50px' # 设置顶部留白区域高度
- }
- )
- )
- if __name__ == '__main__':
- app.run_server(debug=True)
注意,我们这里使用到的Table()部件来自dash_bootstrap_components,而表格其余的构成部件均来自Dash原生的dash_html_components库,这些部件分别的作用如下:
「Table()」
Table()是一张静态表格最外层的部件,而之所以选择dash_bootstrap_components中的Table(),是因为其自带了诸多实用参数,常用的如下:
- 「bordered」:bool型,用于设置是否「保留」表格外边框线
- 「borderless」:bool型,用于设置是否「删除」表格内部单元格框线
- 「striped」:bool型,用于设置是否对数值行应用「斑马着色」方案,即相邻行背景色不同
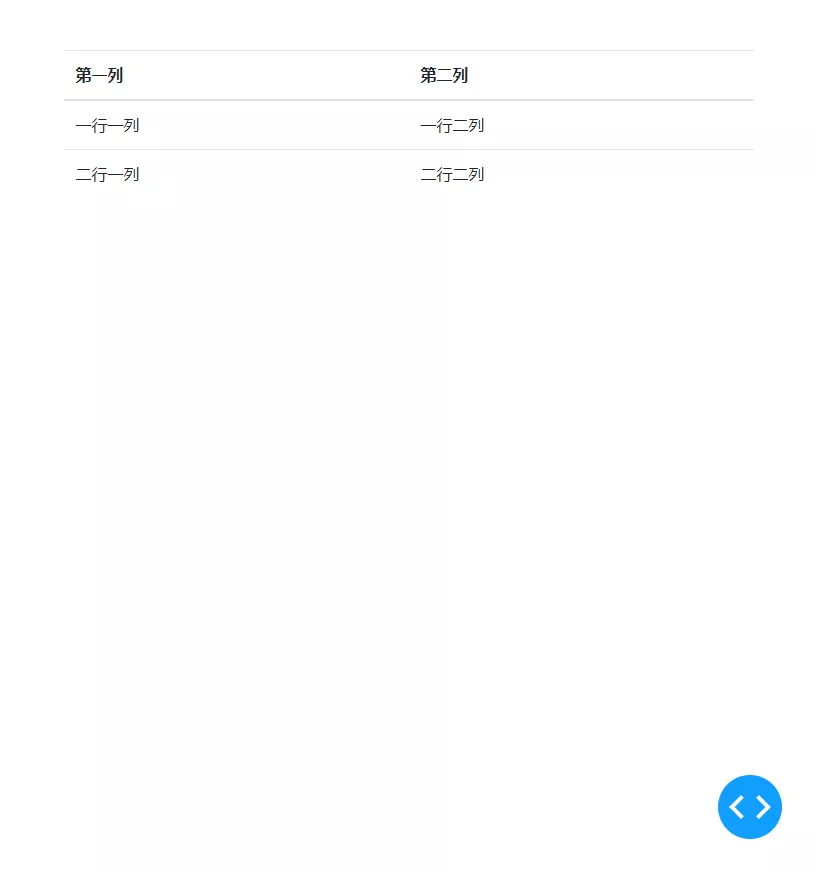
- 「dark」:bool型,用于设置是否应用「暗黑」主题
- 「hover」:bool型,当设置为True时,鼠标悬浮于某行会有对应的效果
通过上述参数,我们就可以改变静态表格的整体效果,譬如设置dark=True之后的app1.py效果如下:
「Thead()与Tbody()」
在部件Table()之下一级需要子元素Thead()与Tbody(),分别用于存放表头信息以及表数值内容信息。
「Tr()、Th()与Td()」
经过前面Table()嵌套Thead()与Tbody()的过程之后,我们就可以分别开始在「表头区域」和「数值区域」正式组织数据内容。
既然是一张表格,那么还是要按照先行后列的网格方式组织内容。而Tr()部件的作用就是作为行容器,其内部嵌套的子元素则是表格中每个单元格位置上的元素。
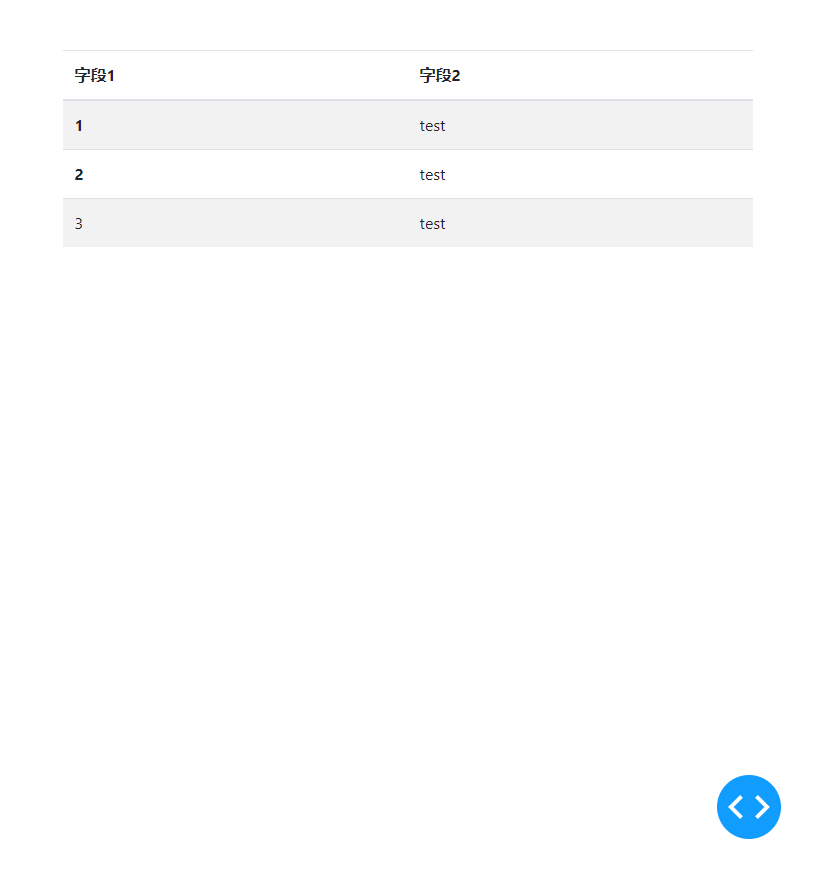
其中在Thead()嵌套的Tr()内部,需要使用Th()来设置每列的字段名称,而在Tbody()嵌套的Tr()内部,Td()与Th()都可以用来设置每个单元格的数值内容,只不过Th()在表现单元格数值时有加粗效果:
❝app2.py❞
- import dash
- import dash_html_components as html
- import dash_bootstrap_components as dbc
- app = dash.Dash(__name__)
- app.layout = html.Div(
- dbc.Container(
- dbc.Table(
- [
- html.Thead(
- html.Tr(
- [
- html.Th('字段1'),
- html.Th('字段2')
- ]
- )
- ),
- html.Tbody(
- [
- html.Tr(
- [
- html.Th('1'),
- html.Td('test')
- ]
- ),
- html.Tr(
- [
- html.Th('2'),
- html.Td('test')
- ]
- ),
- html.Tr(
- [
- html.Td('3'),
- html.Td('test')
- ]
- )
- ]
- )
- ],
- striped=True
- ),
- style={
- 'margin-top': '50px' # 设置顶部留白区域高度
- }
- )
- )
- if __name__ == '__main__':
- app.run_server(debug=True)
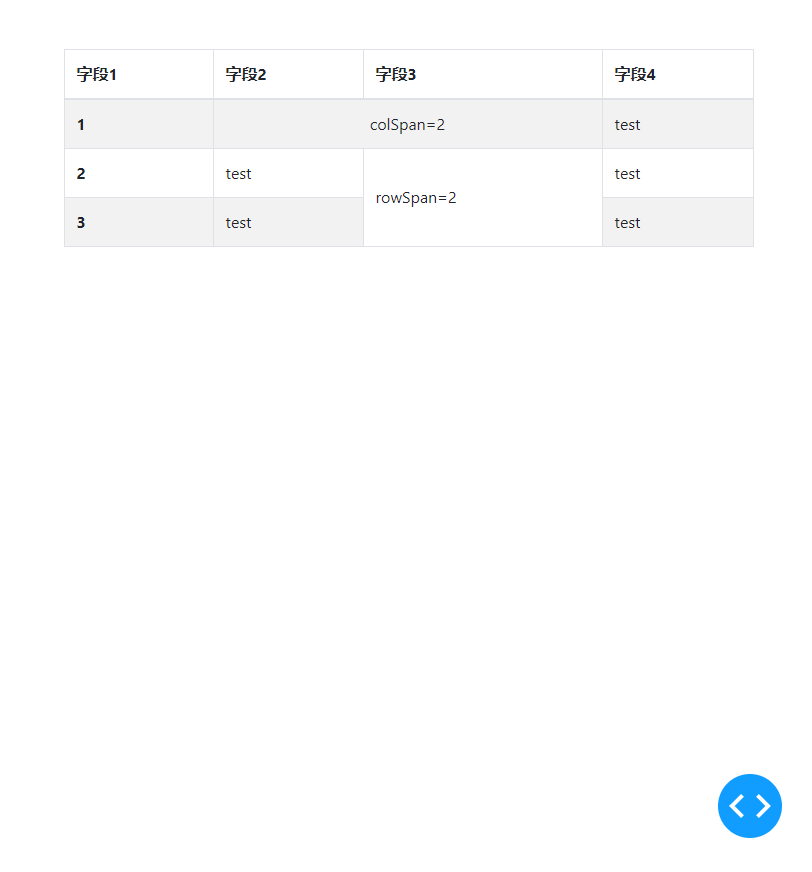
而Th()与Td()均有额外参数colSpan与rowSpan,可以传入整数,来实现横向或纵向「合并单元格」的效果,譬如下面的例子:
❝app3.py❞
- import dash
- import dash_html_components as html
- import dash_bootstrap_components as dbc
- app = dash.Dash(__name__)
- app.layout = html.Div(
- dbc.Container(
- dbc.Table(
- [
- html.Thead(
- html.Tr(
- [
- html.Th('字段1'),
- html.Th('字段2'),
- html.Th('字段3'),
- html.Th('字段4'),
- ]
- )
- ),
- html.Tbody(
- [
- html.Tr(
- [
- html.Th('1'),
- # style设置水平居中
- html.Td('colSpan=2', colSpan=2, style={'text-align': 'center'}),
- html.Td('test'),
- ]
- ),
- html.Tr(
- [
- html.Th('2'),
- html.Td('test'),
- # style设置垂直居中
- html.Td('rowSpan=2', rowSpan=2, style={'vertical-align': 'middle'}),
- html.Td('test')
- ]
- ),
- html.Tr(
- [
- html.Th('3'),
- html.Td('test'),
- html.Td('test')
- ]
- )
- ]
- )
- ],
- striped=True,
- bordered=True
- ),
- style={
- 'margin-top': '50px' # 设置顶部留白区域高度
- }
- )
- )
- if __name__ == '__main__':
- app.run_server(debug=True)
2.2 快速表格渲染
2.2.1 利用列表推导快速渲染静态表格
通过前面的内容,我们知晓了在Dash中如果渲染一张带有样式的静态表格,而日常需求中,面对批量的数据,我们当然不可能手动编写整张表对应的代码,对于数量较多的表格,我们可以配合Python中常用的列表推导来实现。
比如下面的例子:
❝app4.py❞
- import dash
- import dash_html_components as html
- import dash_bootstrap_components as dbc
- import pandas as pd
- import numpy as np
- fake_df = pd.DataFrame(np.random.rand(1000).reshape(200, 5))
- fake_df.rename(lambda s: f'字段{s}', axis=1, inplace=True) # 批量格式化列名
- app = dash.Dash(__name__)
- app.layout = html.Div(
- dbc.Container(
- dbc.Table(
- [
- html.Thead(
- html.Tr(
- [html.Th('行下标', style={'text-align': 'center'})] +
- [
- html.Th(column, style={'text-align': 'center'})
- for column in fake_df.columns
- ]
- )
- ),
- html.Tbody(
- [
- html.Tr(
- [html.Th(f'#{idx}', style={'text-align': 'center'})] +
- [
- html.Td(row[column], style={'text-align': 'center'})
- for column in fake_df.columns
- ]
- )
- for idx, row in fake_df.iterrows()
- ]
- )
- ],
- striped=True,
- bordered=True
- ),
- style={
- 'margin-top': '50px' # 设置顶部留白区域高度
- }
- )
- )
- if __name__ == '__main__':
- app.run_server(debug=True)
在生成表头和每行内容时应用列表推导,使得我们的代码更加简洁。
2.2.2 利用from_dataframe()快速渲染表格
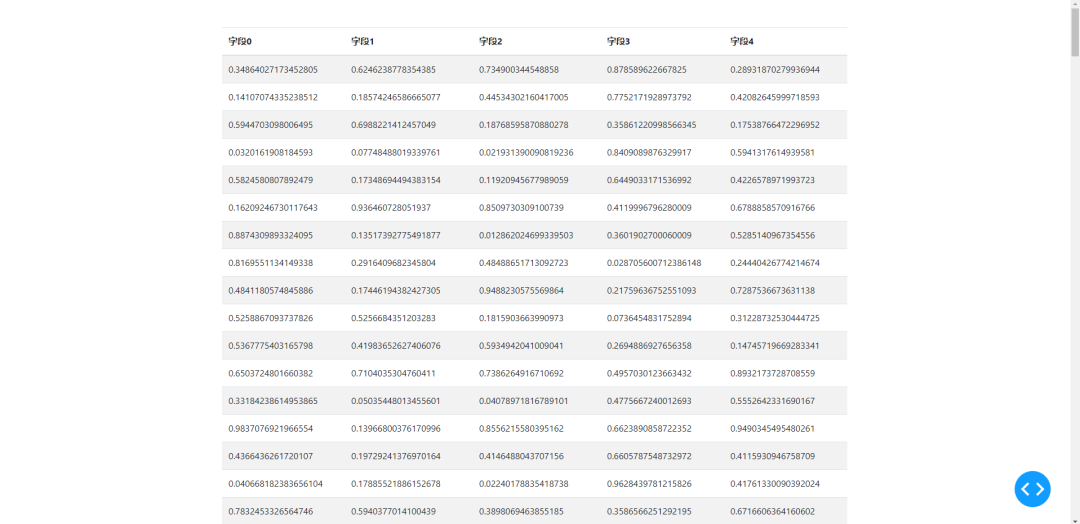
上述的列表推导方式虽说已经简洁了很多,但dash_bootstrap_components还提供了Table.from_dataframe()方法,可以直接传入pandas数据框来快速制作简易的静态表格。
它的样式相关参数与dbc.Table()一致,缺点是自定义表格内部元素样式的自由度没有前面列表推导高:
❝app5.py❞
- import dash
- import dash_html_components as html
- import dash_bootstrap_components as dbc
- import pandas as pd
- import numpy as np
- fake_df = pd.DataFrame(np.random.rand(1000).reshape(200, 5))
- fake_df.rename(lambda s: f'字段{s}', axis=1, inplace=True) # 批量格式化列名
- app = dash.Dash(__name__)
- app.layout = html.Div(
- dbc.Container(
- # 一行代码渲染静态表格
- dbc.Table.from_dataframe(fake_df, striped=True),
- style={
- 'margin-top': '50px' # 设置顶部留白区域高度
- }
- )
- )
- if __name__ == '__main__':
- app.run_server(debug=True)
3 自制简易的数据库查询系统
在学习了今天的内容之后,我们就可以创建很多以表格为主体内容的web应用,典型如数据库查询系统,我们以Postgresql为例,配合pandas与sqlalchemy的相关功能,来快速打造一个简单的数据库查询系统。
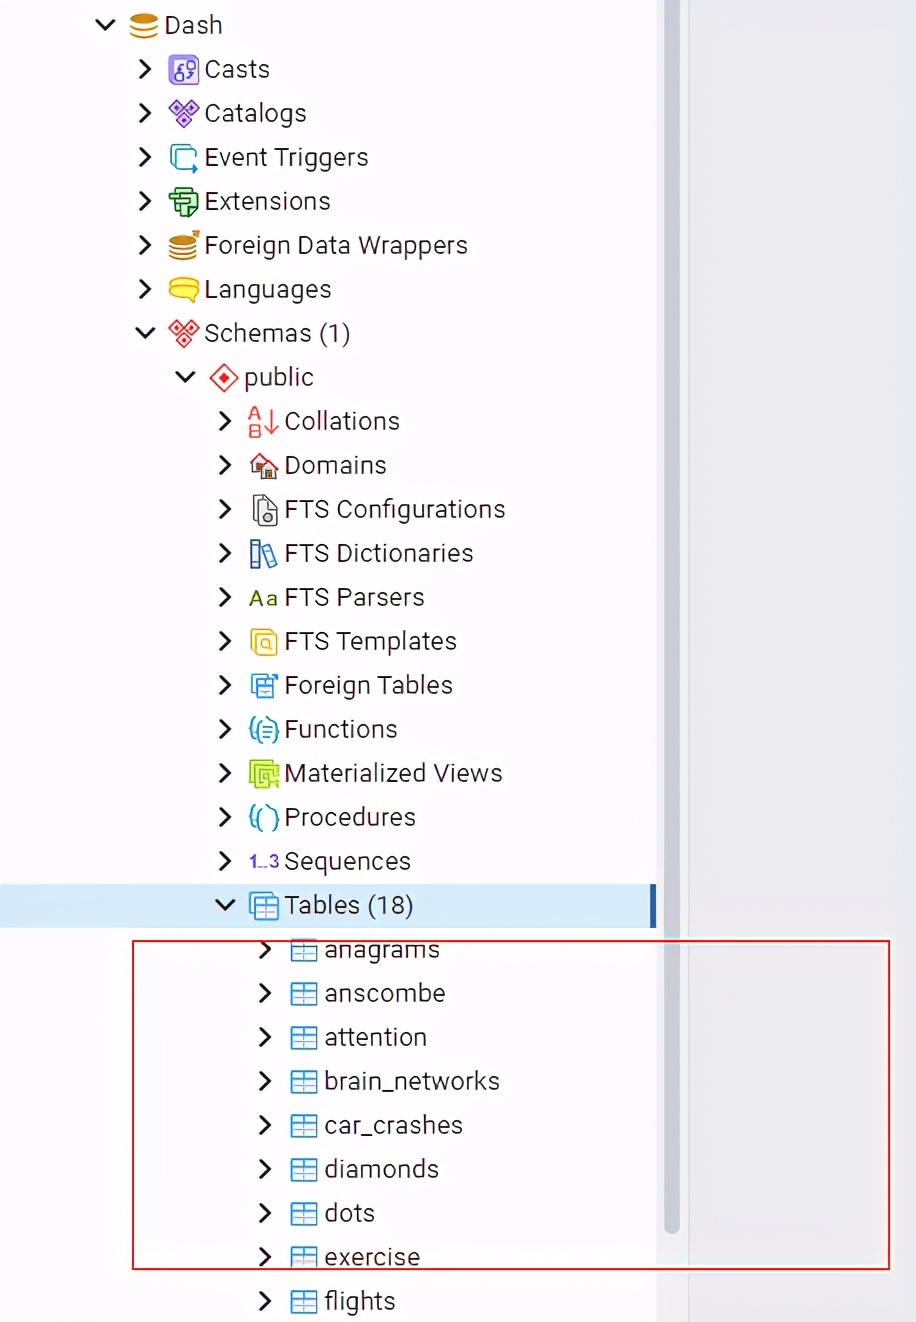
首先将本期附件中的所有数据表利用下面的代码导入目标数据库中:
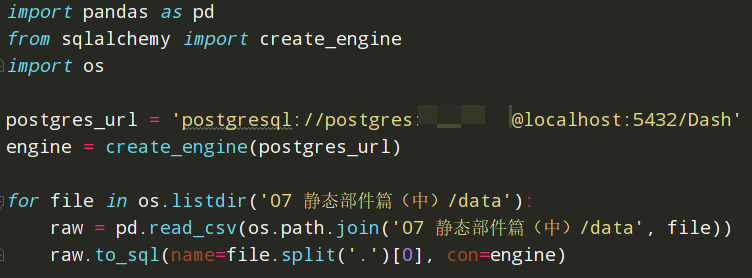
接着只需要配合Dash,短短的几十行代码就可以实现。
对应代码如下:
❝app6.py❞
- import dash
- import dash_html_components as html
- import dash_bootstrap_components as dbc
- import dash_core_components as dcc
- from dash.dependencies import Input, Output, State
- import pandas as pd
- from sqlalchemy import create_engine
- postgres_url = 'postgresql://postgres:填入你的密码@localhost:5432/Dash'
- engine = create_engine(postgres_url)
- app = dash.Dash(__name__)
- app.layout = html.Div(
- dbc.Container(
- [
- dbc.Row(
- [
- dbc.Col(dbc.Button('更新数据库信息', id='refresh-db', style={'width': '100%'}), width=2),
- dbc.Col(dcc.Dropdown(id='db-table-names', placeholder='选择库中数据表', style={'width': '100%'}), width=4),
- dbc.Col(dbc.Button('查询', id='query', style={'width': '100%'}), width=1)
- ]
- ),
- html.Hr(),
- dbc.Row(
- [
- dbc.Col(
- id='query-result'
- )
- ]
- )
- ],
- style={
- 'margin-top': '50px' # 设置顶部留白区域高度
- }
- )
- )
- @app.callback(
- Output('db-table-names', 'options'),
- Input('refresh-db', 'n_clicks'),
- prevent_initial_call=True
- )
- def query_data_records(n_clicks):
- # 提取目标表格并查询其最多前500行记录
- table_names = pd.read_sql_query("select tablename from pg_tables where schemaname='public'", con=engine)
- return [{'label': name, 'value': name} for name in table_names['tablename']]
- @app.callback(
- Output('query-result', 'children'),
- Input('query', 'n_clicks'),
- State('db-table-names', 'value'),
- prevent_initial_call=True
- )
- def refresh_table_names(n_clicks, value):
- if value:
- query_result = pd.read_sql_query(f'select * from {value} limit 500', con=engine)
- return html.Div(dbc.Table.from_dataframe(query_result, striped=True), style={'height': '600px', 'overflow': 'auto'})
- else:
- return dash.no_update
- if __name__ == '__main__':
- app.run_server(debug=True)
以上就是本文的全部内容,欢迎在评论区与我进行讨论。