一、MySQL自带的压力测试工具 Mysqlslap
mysqlslap是mysql自带的基准测试工具,该工具查询数据,语法简单,灵活容易使用.该工具可以模拟多个客户端同时并发的向服务器发出查询更新,给出了性能测试数据而且提供了多种引擎的性能比较。mysqlslap为mysql性能优化前后提供了直观的验证依据,系统运维和DBA人员应该掌握一些常见的压力测试工具,才能准确的掌握线上数据库支撑的用户流量上限及其抗压性等问题。
1、更改其默认的最大连接数
在对MySQL进行压力测试之前,需要更改其默认的最大连接数,如下:
[root@mysql ~]# vim /etc/my.cnf
................
[mysqld]
max_connections=1024
[root@mysql ~]# systemctl restart mysqld
- 1.
- 2.
- 3.
- 4.
- 5.
查看最大连接数
mysql> show variables like 'max_connections';
+-----------------+-------+
| Variable_name   | Value |
+-----------------+-------+
| max_connections | 1024  |
+-----------------+--------+
1 row in set (0.00 sec)
- 1.
- 2.
- 3.
- 4.
- 5.
- 6.
- 7.
进行压力测试:
[root@mysql ~]# mysqlslap --defaults-file=/etc/my.cnf --concurrency=100,200 --iterations=1 --number-int-cols=20 --number-char-cols=30 \
--auto-generate-sql --auto-generate-sql-add-autoincrement --auto-generate-sql-load-type=mixed --engine=myisam,innodb --number-of-queries=2000 -uroot -p123 --verbose
- 1.
- 2.
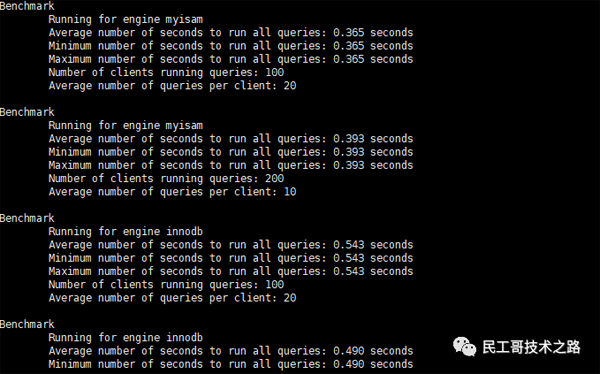
上述命令测试说明:模拟测试两次读写并发,第一次100,第二次200,自动生成SQL脚本,测试表包含20个init字段,30个char字段,每次执行2000查询请求。测试引擎分别是myisam,innodb。(上述选项中有很多都是默认值,可以省略,如果想要了解各个选项的解释,可以使用mysqlslap --help进行查询)。
测试结果说明:
- Myisam第一次100客户端同时发起增查用0.557/s,第二次200客户端同时发起增查用0.522/s
- Innodb第一次100客户端同时发起增查用0.256/s,第二次200客户端同时发起增查用0.303/s
可以根据实际需求,一点点的加大并发数量进行压力测试。
二、使用第三方sysbench工具进行压力测试
1、安装sysbench工具
[root@mysql ~]# yum -y install epel-release #安装第三方epel源
[root@mysql ~]# yum -y install sysbench #安装sysbench工具
[root@mysql ~]# sysbench --version #确定工具已安装
sysbench 1.0.17
- 1.
- 2.
- 3.
- 4.
sysbench可以进行以下测试:
- CPU 运算性能测试
- 磁盘 IO 性能测试
- 调度程序性能测试
- 内存分配及传输速度测试
- POSIX 线程性能测试
数据库性能测试(OLTP 基准测试,需要通过 /usr/share/sysbench/ 目录中的 Lua 脚本执行,例如 oltp_read_only.lua 脚本执行只读测试)。
sysbench 还可以通过运行命令时指定自己的 Lua 脚本来自定义测试。
2、查看sysbench工具的帮助选项
[root@mysql ~]# sysbench --help
Usage:
sysbench [options]... [testname] [command]
Commands implemented by most tests: prepare run cleanup help # 可用的命令,四个
General options: # 通用选项
--threads=N 要使用的线程数,默认 1 个 [1]
--events=N 最大允许的事件个数 [0]
--time=N 最大的总执行时间,以秒为单位 [10]
--forced-shutdown=STRING 在 --time 时间限制到达后,强制关闭之前等待的秒数,默认“off”禁用(number of seconds to wait after the --time limit before forcing shutdown, or 'off' to disable) [off]
--thread-stack-size=SIZE 每个线程的堆栈大小 [64K]
--rate=N 平均传输速率。0 则无限制 [0]
--report-interval=N 以秒为单位定期报告具有指定间隔的中间统计信息 0 禁用中间报告 [0]
--report-checkpoints=[LIST,...] 转储完整的统计信息并在指定的时间点重置所有计数器。参数是一个逗号分隔的值列表,表示从测试开始经过这个时间量时必须执行报告检查点(以秒为单位)。报告检查点默认关闭。 []
--debug[=on|off] 打印更多 debug 信息 [off]
--validate[=on|off] 尽可能执行验证检查 [off]
--help[=on|off] 显示帮助信息并退出 [off]
--version[=on|off] 显示版本信息并退出 [off]
--config-file=FILENAME 包含命令行选项的文件
--tx-rate=N 废弃,改用 --rate [0]
--max-requests=N 废弃,改用 --events [0]
--max-time=N 废弃,改用 --time [0]
--num-threads=N 废弃,改用 --threads [1]
Pseudo-Random Numbers Generator options: # 伪随机数发生器选项
--rand-type=STRING random numbers distribution {uniform,gaussian,special,pareto} [special]
--rand-spec-iter=N number of iterations used for numbers generation [12]
--rand-spec-pct=N percentage of values to be treated as 'special' (for special distribution) [1]
--rand-spec-res=N percentage of 'special' values to use (for special distribution) [75]
--rand-seed=N seed for random number generator. When 0, the current time is used as a RNG seed. [0]
--rand-pareto-h=N parameter h for pareto distribution [0.2]
Log options: # 日志选项
--verbosity=N verbosity level {5 - debug, 0 - only critical messages} [3]
--percentile=N percentile to calculate in latency statistics (1-100). Use the special value of 0 to disable percentile calculations [95]
--histogram[=on|off] print latency histogram in report [off]
General database options: # 通用的数据库选项
--db-driver=STRING 指定要使用的数据库驱动程序 ('help' to get list of available drivers)
--db-ps-mode=STRING prepared statements usage mode {auto, disable} [auto]
--db-debug[=on|off] print database-specific debug information [off]
Compiled-in database drivers: # 內建的数据库驱动程序,默认支持 MySQL 和 PostgreSQL
mysql - MySQL driver
pgsql - PostgreSQL driver
mysql options: # MySQL 数据库专用选项
--mysql-host=[LIST,...] MySQL server host [localhost]
--mysql-port=[LIST,...] MySQL server port [3306]
--mysql-socket=[LIST,...] MySQL socket
--mysql-user=STRING MySQL user [sbtest]
--mysql-password=STRING MySQL password []
--mysql-db=STRING MySQL database name [sbtest]
--mysql-ssl[=on|off] use SSL connections, if available in the client library [off]
--mysql-ssl-cipher=STRING use specific cipher for SSL connections []
--mysql-compression[=on|off] use compression, if available in the client library [off]
--mysql-debug[=on|off] trace all client library calls [off]
--mysql-ignore-errors=[LIST,...] list of errors to ignore, or "all" [1213,1020,1205]
--mysql-dry-run[=on|off] Dry run, pretend that all MySQL client API calls are successful without executing them [off]
pgsql options: # PostgreSQL 数据库专用选项
--pgsql-host=STRING PostgreSQL server host [localhost]
--pgsql-port=N PostgreSQL server port [5432]
--pgsql-user=STRING PostgreSQL user [sbtest]
--pgsql-password=STRING PostgreSQL password []
--pgsql-db=STRING PostgreSQL database name [sbtest]
Compiled-in tests: # 內建测试类型
fileio - File I/O test
cpu - CPU performance test
memory - Memory functions speed test
threads - Threads subsystem performance test
mutex - Mutex performance test
See 'sysbench <testname> help' for a list of options for each test.
- 1.
- 2.
- 3.
- 4.
- 5.
- 6.
- 7.
- 8.
- 9.
- 10.
- 11.
- 12.
- 13.
- 14.
- 15.
- 16.
- 17.
- 18.
- 19.
- 20.
- 21.
- 22.
- 23.
- 24.
- 25.
- 26.
- 27.
- 28.
- 29.
- 30.
- 31.
- 32.
- 33.
- 34.
- 35.
- 36.
- 37.
- 38.
- 39.
- 40.
- 41.
- 42.
- 43.
- 44.
- 45.
- 46.
- 47.
- 48.
- 49.
- 50.
- 51.
- 52.
- 53.
- 54.
- 55.
- 56.
- 57.
- 58.
- 59.
- 60.
- 61.
- 62.
- 63.
- 64.
- 65.
- 66.
3、sysbench测试MySQL数据库性能
1)准备测试数据
#查看sysbench自带的lua脚本使用方法
[root@mysql ~]# sysbench /usr/share/sysbench/oltp_common.lua help
#必须创建sbtest库,sbtest是sysbench默认使用的库名
[root@mysql ~]# mysqladmin -uroot -p123 create sbtest;
#然后,准备测试所用的表,这些测试表放在测试库sbtest中。这里使用的lua脚本为/usr/share/sysbench/oltp_common.lua。
[root@mysql ~]# sysbench --mysql-host=127.0.0.1 \
--mysql-port=3306 \
--mysql-user=root \
--mysql-password=123 \
/usr/share/sysbench/oltp_common.lua \
--tables=10 \
--table_size=100000 \
prepare
#其中--tables=10表示创建10个测试表,
#--table_size=100000表示每个表中插入10W行数据,
#prepare表示这是准备数的过程。
- 1.
- 2.
- 3.
- 4.
- 5.
- 6.
- 7.
- 8.
- 9.
- 10.
- 11.
- 12.
- 13.
- 14.
- 15.
- 16.
2)确认测试数据以存在
[root@mysql ~]# mysql -uroot -p123 sbtest; #登录到sbtest库
mysql> show tables; #查看相应的表
+------------------+
| Tables_in_sbtest |
+------------------+
| sbtest1 |
| sbtest10 |
| sbtest2 |
| sbtest3 |
| sbtest4 |
| sbtest5 |
| sbtest6 |
| sbtest7 |
| sbtest8 |
| sbtest9 |
+------------------+
10 rows in set (0.00 sec)
- 1.
- 2.
- 3.
- 4.
- 5.
- 6.
- 7.
- 8.
- 9.
- 10.
- 11.
- 12.
- 13.
- 14.
- 15.
- 16.
- 17.
mysql> select count(*) from sbtest1; #随机选择一个表,确认其有100000条数据
+----------+
| count(*) |
+----------+
| 100000 |
+----------+
1 row in set (0.01 sec)
- 1.
- 2.
- 3.
- 4.
- 5.
- 6.
- 7.
3)数据库测试和结果分析
稍微修改下之前准备数据的语句,就可以拿来测试了。需要注意的是,之前使用的lua脚本为oltp_common.lua,它是一个通用脚本,是被其它lua脚本调用的,它不能直接拿来测试。
所以,我这里用oltp_read_write.lua脚本来做读、写测试。还有很多其它类型的测试,比如只读测试、只写测试、删除测试、大批量插入测试等等。可找到对应的lua脚本进行调用即可。
#执行测试命令如下:
[root@mysql ~]# sysbench --threads=4 \
--time=20 \
--report-interval=5 \
--mysql-host=127.0.0.1 \
--mysql-port=3306 \
--mysql-user=root \
--mysql-password=123 \
/usr/share/sysbench/oltp_read_write.lua \
--tables=10 \
--table_size=100000 \
run
- 1.
- 2.
- 3.
- 4.
- 5.
- 6.
- 7.
- 8.
- 9.
- 10.
- 11.
上述命令返回的结果如下:
[root@mysql ~]# sysbench --threads=4 --time=20 --report-interval=5 --mysql-host=127.0.0.1 --mysql-port=3306 --mysql-user=root --mysql-password=123 /usr/share/sysbench/oltp_read_write.lua --tables=10 --table_size=100000 run
sysbench 1.0.17 (using system LuaJIT 2.0.4)
Running the test with following options:
Number of threads: 4
Report intermediate results every 5 second(s)
Initializing random number generator from current time
Initializing worker threads...
Threads started!
#以下是每5秒返回一次的结果,统计的指标包括:
# 线程数、tps(每秒事务数)、qps(每秒查询数)、
# 每秒的读/写/其它次数、延迟、每秒错误数、每秒重连次数
[ 5s ] thds: 4 tps: 1040.21 qps: 20815.65 (r/w/o: 14573.17/4161.25/2081.22) lat (ms,95%): 7.17 err/s: 0.00 reconn/s: 0.00
[ 10s ] thds: 4 tps: 1083.34 qps: 21667.15 (r/w/o: 15165.93/4334.55/2166.68) lat (ms,95%): 6.55 err/s: 0.00 reconn/s: 0.00
[ 15s ] thds: 4 tps: 1121.57 qps: 22429.09 (r/w/o: 15700.64/4485.30/2243.15) lat (ms,95%): 6.55 err/s: 0.00 reconn/s: 0.00
[ 20s ] thds: 4 tps: 1141.69 qps: 22831.98 (r/w/o: 15982.65/4566.16/2283.18) lat (ms,95%): 6.09 err/s: 0.00 reconn/s: 0.00
SQL statistics:
queries performed:
read: 307146 # 执行的读操作数量
write: 87756 # 执行的写操作数量
other: 43878 # 执行的其它操作数量
total: 438780
transactions: 21939 (1096.57 per sec.) # 执行事务的平均速率
queries: 438780 (21931.37 per sec.) # 平均每秒能执行多少次查询
ignored errors: 0 (0.00 per sec.)
reconnects: 0 (0.00 per sec.)
General statistics:
total time: 20.0055s # 总消耗时间
total number of events: 21939 # 总请求数量(读、写、其它)
Latency (ms):
min: 1.39
avg: 3.64
max: 192.05
95th percentile: 6.67 # 采样计算的平均延迟
sum: 79964.26
Threads fairness:
events (avg/stddev): 5484.7500/15.12
execution time (avg/stddev): 19.9911/0.00
- 1.
- 2.
- 3.
- 4.
- 5.
- 6.
- 7.
- 8.
- 9.
- 10.
- 11.
- 12.
- 13.
- 14.
- 15.
- 16.
- 17.
- 18.
- 19.
- 20.
- 21.
- 22.
- 23.
- 24.
- 25.
- 26.
- 27.
- 28.
- 29.
- 30.
- 31.
- 32.
- 33.
- 34.
- 35.
- 36.
- 37.
4、cpu/io/内存等测试
sysbench内置的几个测试指标如下:
[root@mysql ~]# sysbench --help
.......... # 省略部分内容
Compiled-in tests:
fileio - File I/O test
cpu - CPU performance test
memory - Memory functions speed test
threads - Threads subsystem performance test
mutex - Mutex performance test
- 1.
- 2.
- 3.
- 4.
- 5.
- 6.
- 7.
- 8.
可以直接help输出测试方法,例如,fileio测试:
[root@mysql ~]# sysbench fileio help
sysbench 1.0.17 (using system LuaJIT 2.0.4)
fileio options:
--file-num=N number of files to create [128]
--file-block-size=N block size to use in all IO operations [16384]
--file-total-size=SIZE total size of files to create [2G]
--file-test-mode=STRING test mode {seqwr, seqrewr, seqrd, rndrd, rndwr, rndrw}
--file-io-mode=STRING file operations mode {sync,async,mmap} [sync]
--file-async-backlog=N number of asynchronous operatons to queue per thread [128]
--file-extra-flags=[LIST,...] list of additional flags to use to open files {sync,dsync,direct} []
--file-fsync-freq=N do fsync() after this number of requests (0 - don't use fsync()) [100]
--file-fsync-all[=on|off] do fsync() after each write operation [off]
--file-fsync-end[=on|off] do fsync() at the end of test [on]
--file-fsync-mode=STRING which method to use for synchronization {fsync, fdatasync} [fsync]
--file-merged-requests=N merge at most this number of IO requests if possible (0 - don't merge) [0]
--file-rw-ratio=N reads/writes ratio for combined test [1.5]
- 1.
- 2.
- 3.
- 4.
- 5.
- 6.
- 7.
- 8.
- 9.
- 10.
- 11.
- 12.
- 13.
- 14.
- 15.
- 16.
1)测试io性能
例如,创建5个文件,总共2G,每个文件大概400M。
[root@mysql ~]# sysbench fileio --file-num=5 --file-total-size=2G prepare
[root@mysql ~]# ll -lh test*
-rw------- 1 root root 410M May 26 16:05 test_file.0
-rw------- 1 root root 410M May 26 16:05 test_file.1
-rw------- 1 root root 410M May 26 16:05 test_file.2
-rw------- 1 root root 410M May 26 16:05 test_file.3
-rw------- 1 root root 410M May 26 16:05 test_file.4
- 1.
- 2.
- 3.
- 4.
- 5.
- 6.
- 7.
然后运行测试:
[root@mysql ~]# sysbench --events=5000 \
--threads=16 \
fileio \
--file-num=5 \
--file-total-size=2G \
--file-test-mode=rndrw \
--file-fsync-freq=0 \
--file-block-size=16384 \
run
- 1.
- 2.
- 3.
- 4.
- 5.
- 6.
- 7.
- 8.
- 9.
返回的结果如下:
Running the test with following options:
Number of threads: 16
Initializing random number generator from current time
Extra file open flags: (none)
5 files, 409.6MiB each
2GiB total file size
Block size 16KiB
Number of IO requests: 5000
Read/Write ratio for combined random IO test: 1.50
Calling fsync() at the end of test, Enabled.
Using synchronous I/O mode
Doing random r/w test
Initializing worker threads...
Threads started!
File operations:
reads/s: 9899.03
writes/s: 6621.38
fsyncs/s: 264.33
Throughput: # 吞吐量
read, MiB/s: 154.66 #表示读带宽
written, MiB/s: 103.46 #表示写的带宽
General statistics:
total time: 0.3014s
total number of events: 5000
Latency (ms):
min: 0.00
avg: 0.81
max: 53.56
95th percentile: 4.10
sum: 4030.48
Threads fairness:
events (avg/stddev): 312.5000/27.64
execution time (avg/stddev): 0.2519/0.02
- 1.
- 2.
- 3.
- 4.
- 5.
- 6.
- 7.
- 8.
- 9.
- 10.
- 11.
- 12.
- 13.
- 14.
- 15.
- 16.
- 17.
- 18.
- 19.
- 20.
- 21.
- 22.
- 23.
- 24.
- 25.
- 26.
- 27.
- 28.
- 29.
- 30.
- 31.
- 32.
- 33.
2)测试cpu性能
[root@mysql ~]# sysbench cpu --threads=40 --events=10000 --cpu-max-prime=20000 run
- 1.
压测时,还请小心谨慎!!!!