随着业务的越发复杂,软件系统也越来越庞大,对软件系统的要求越来越高,意味着我们需要随时掌控系统的运行情况。因此,系统的实时监控以及可视化展示,就显得非常重要。
今天来介绍下使用Grafana + Prometheus快速搭建监控平台。
总体可视化方案
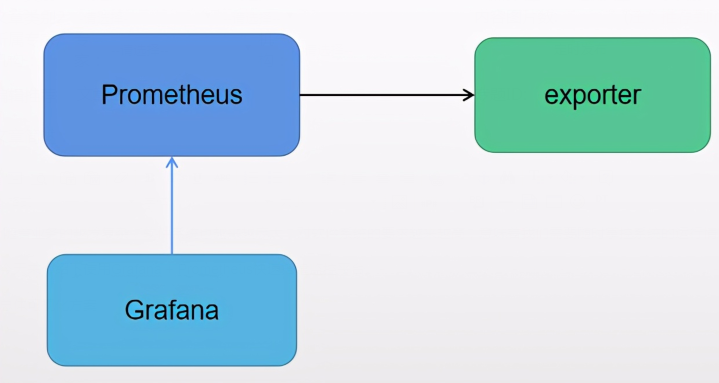
Grafana:通过将采集的数据查询然后可视化的展示
Prometheus:存储的是时序数据,即按相同时序(相同名称和标签),以时间维度存储连续的数据的集合
Exporter:它是prometheus监控中重要的组成部分,负责数据指标的采集
Grafana介绍
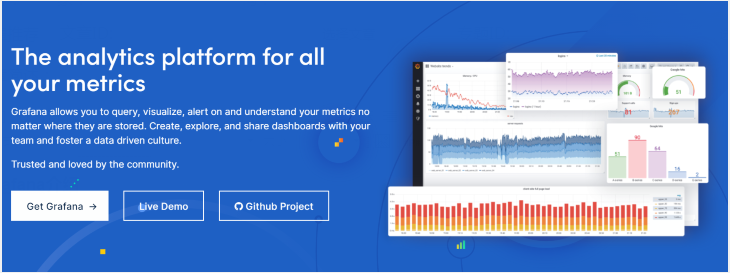
Grafana是一个开源的度量分析与可视化套件。经常被用作基础设施的时间序列数据和应用程序分析的可视化。
Grafana支持许多不同的数据源。每个数据源都有一个特定的查询编辑器,该编辑器定制的特性和功能是公开的特定数据来源。
Prometheus介绍

Prometheus是一套开源的系统监控和报警框架,可以理解Prometheus是数据库,它需要配合Exporter使用。Exporter是负责数据汇报的程序,不同的Exporter负责不同的业务。其统一命名格式:xx_exporter。
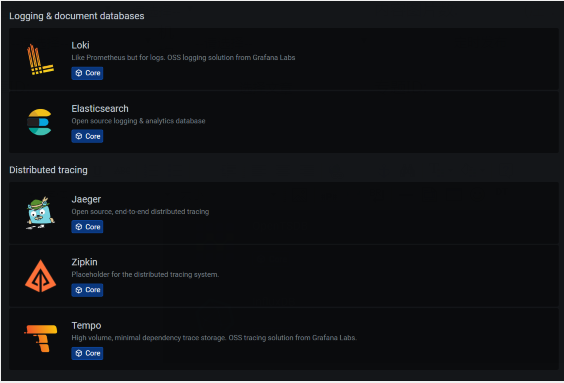
Prometheus官方提供的exporter有blackbox_exporter、consul_exporter、graphite_exporter、haproxy_exporter、memcached_exporter、mysqld_exporter、node_exporter、statsd_exporter,还有很多第三方的exporter,例如:Redis exporter、RabbitMQ exporter等
Prometheus只会采集指定格式的监控信息,它周期性地调用exporter提供的metrics数据接口来获取数据,而exporter就是按照Prometheus规定的格式采集各种软件的监控信息
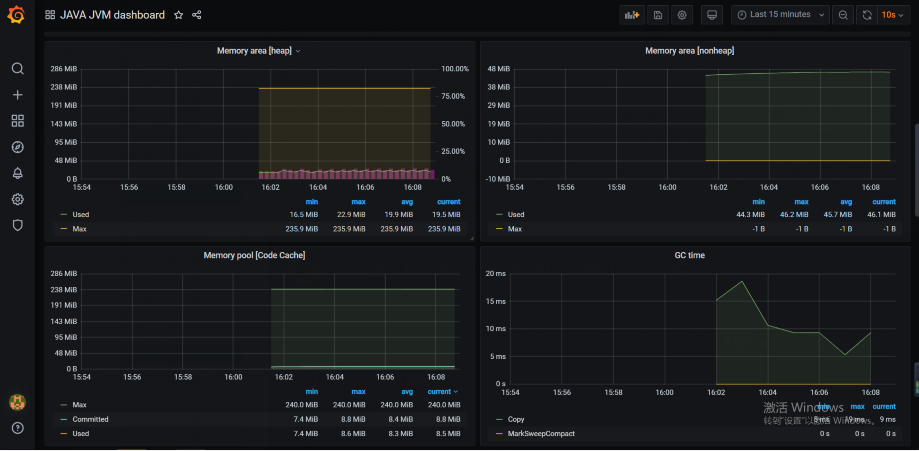
案例:利用JMX监控Java程序效果
搭建过程
本文采用的是Windows系统安装grafana和Prometheus,直接下载双击即可。
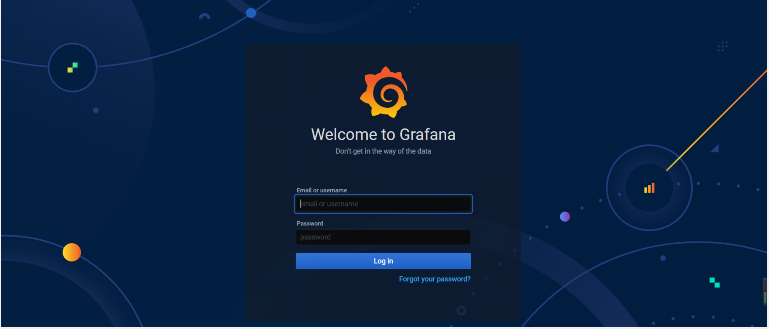
Grafana默认地址:http://127.0.0.1:3000,默认账号和密码都是admin
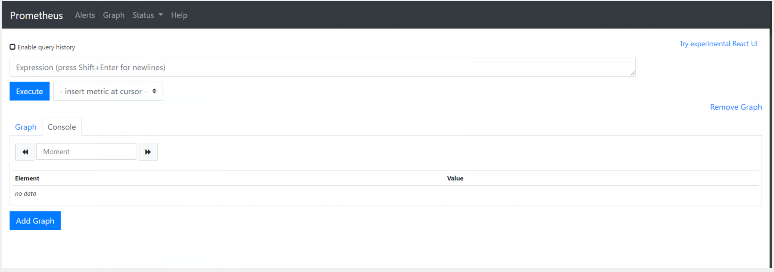
Prometheus默认地址:http://127.0.0.1:9090
jmx_exporter
监控Java程序可以使用jmx_exporter,github地址:https://github.com/prometheus/jmx_exporter
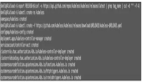
java -javaagent:./jmx_prometheus_javaagent-0.14.0.jar=8081:config.yaml -jar yourJar.jar
config.yaml内容可以参考jmx_exporter项目中example_configs目录
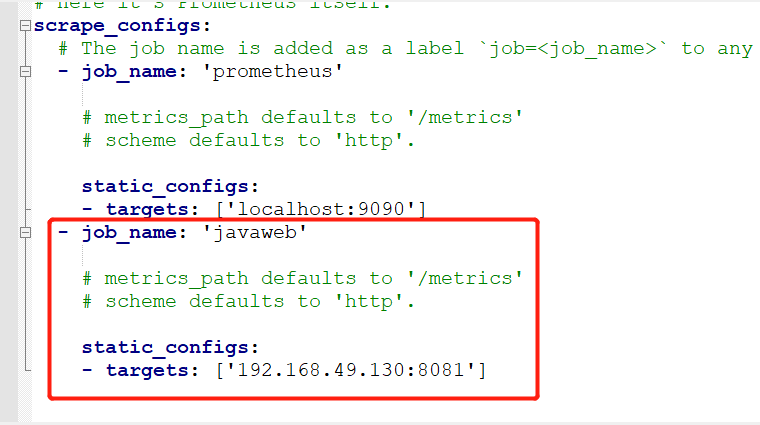
Prometheus配置
修改prometheus.yml,配置需要拉取的exporter的地址
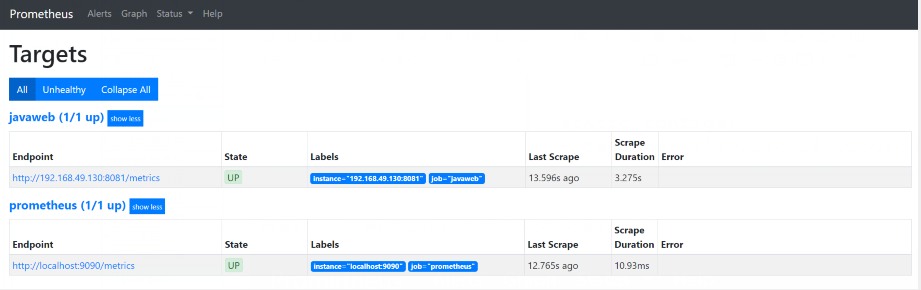
如果看到targets中有你添加的exporter表示已经可以收集到数据了
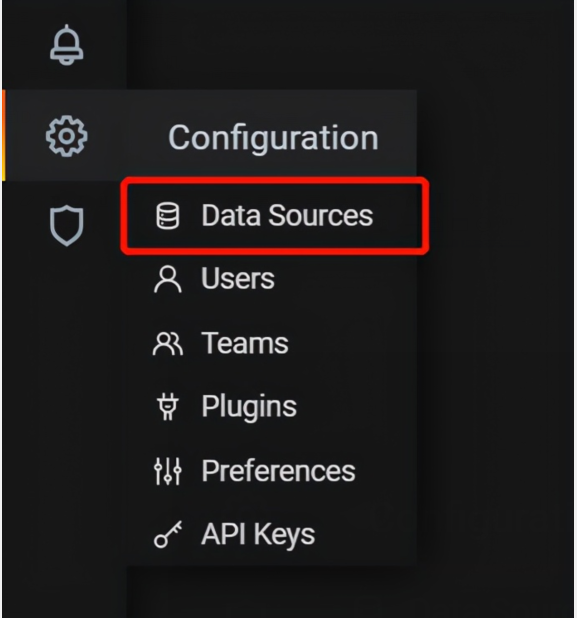
Grafana设置
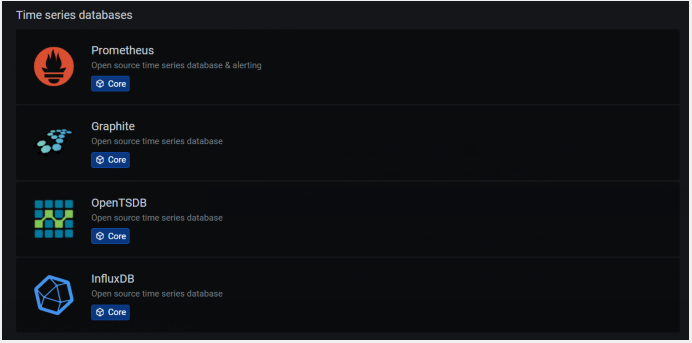
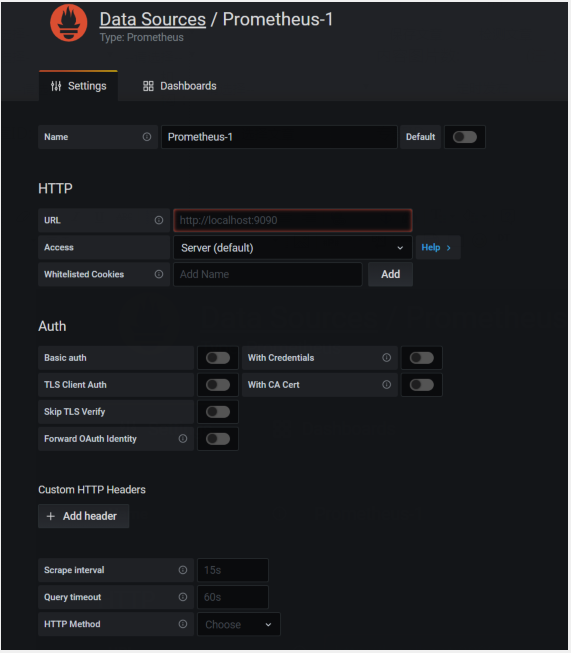
添加数据源
选中prometheus
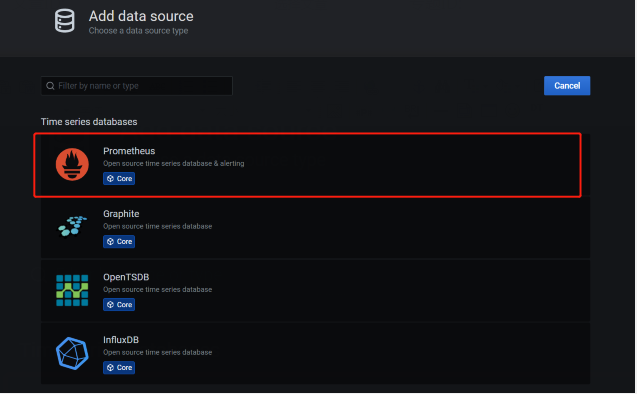
配置地址
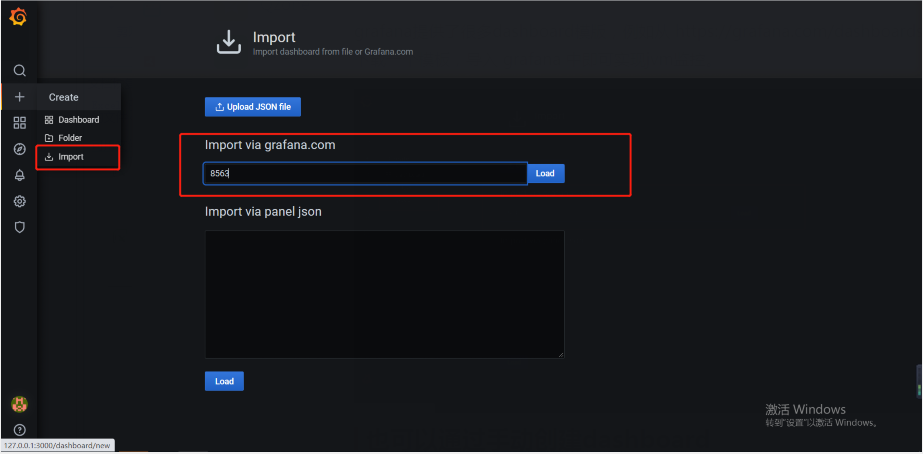
使用Grafana插件生成dashboard
grafana提供了很多dashboard模版,例如从 https://grafana.com/dashboards/8563 这里下载一个模板,导入 grafana 中即可实现jvm监控。
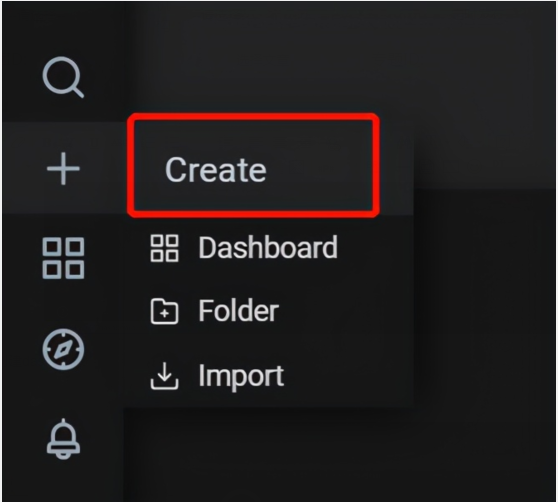
也可以通过手动创建dashboard
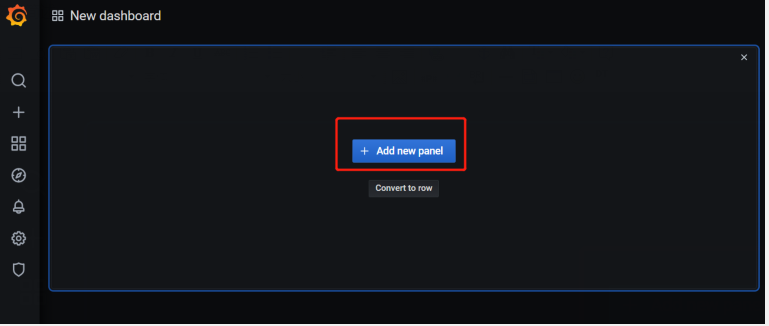
创建监控面板
创建监控指标图表
添加指标
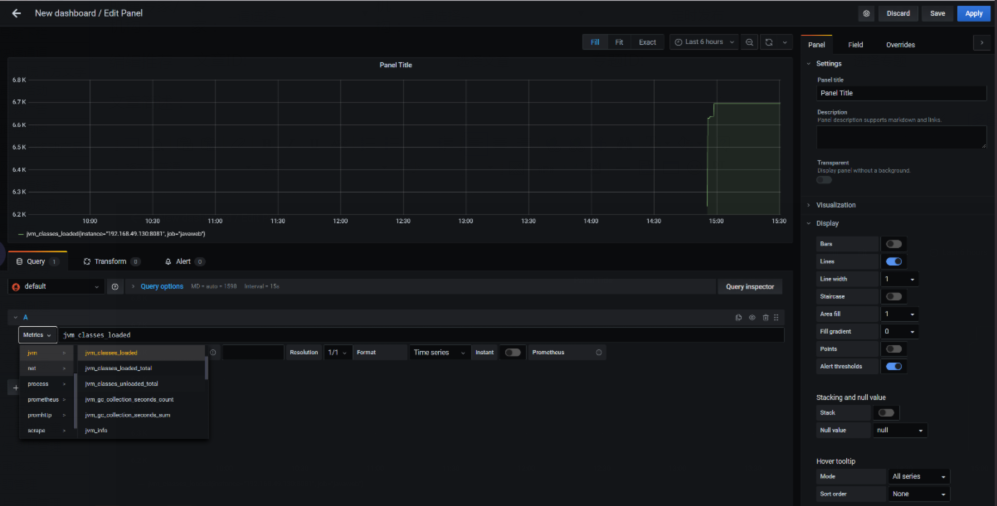
保存即可。
告警功能
是不是感觉实现监控的可视化非常方便,同时prometheus还提供告警插件alertmanager,可以通过alertmanager实现异常监控的报警功能。