前言
这是Python数据可视化的系列短篇,针对初级和中级用户,将理论和示例代码相结合,使用matplotlib, seaborn, plotly等工具创建不同主题的图表。
本文主题是如何在图表中显示误差。
- import os
- import warnings
- import requests
- import numpy as np
- import pandas as pd
- import matplotlib.pyplot as plt
- from statsmodels.tsa.arima_model import ARIMA
- %matplotlib inline
- plt.style.use("fivethirtyeight")
- warnings.filterwarnings("ignore")
1. 显示测量误差
科学测量往往存在误差,准确的报告误差跟报告测量结果同样重要。
测量误差(也称为观察误差)是测量值和真实值之间的差异,包括随机误差(任何实验中都会自然发生的误差)和系统误差(由影响所有测量的错误校准的仪器引起)。
举一个例子,假设您正在测量100个学生的体重,有的学生穿较多的衣服,导致重500克,有的学生可能脱水导致轻200克,这些都是测量误差。事实上所有收集的样本都会存在误差,大多数情况下它们不可避免。所以在数据可视化中,有效显示这些错误可以传达更完整的信息。
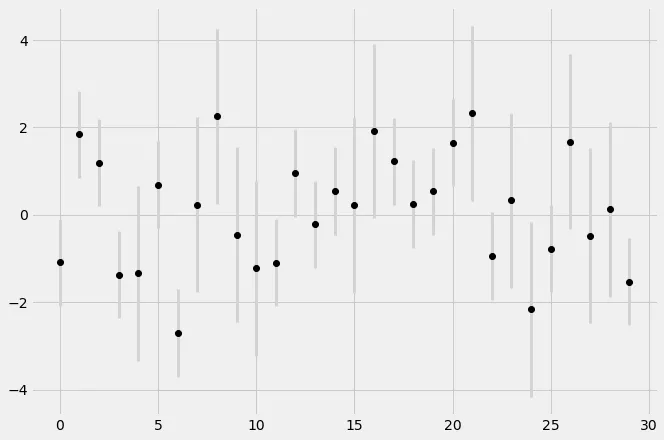
在matplotlib中通过调用ax.errorbar()创建误差图(errorbar)。误差图由一个点和穿过这个点的线段组成,点对应测量结果,线段代表测量误差。
- # 设置随机数种子
- np.random.seed(123)
- # 观测值的数量
- n_observations = 30
- x = np.arange(n_observations)
- # 虚拟测量值
- y = np.sin(x) + np.random.randn(n_observations)
- # 测量误差,假设误差服从均匀分布
- errors = np.random.randint(1, 3, n_observations)
- # 调用ax.errorbar接口,提供3个数组,x, y, yerr
- # fmt控制点和线段的样式,跟ax.plot的fmt相同
- # color: 控制点的颜色
- # ecolor: 代表误差的线段的颜色
- # elinewidth: 代表误差的线段的大小
- fig, ax = plt.subplots(figsize=(10, 7))
- ax.errorbar(x, y, yerr=errors, fmt="o", color="black",
- ecolor="lightgray", elinewidth=3)
2. 显示预测误差
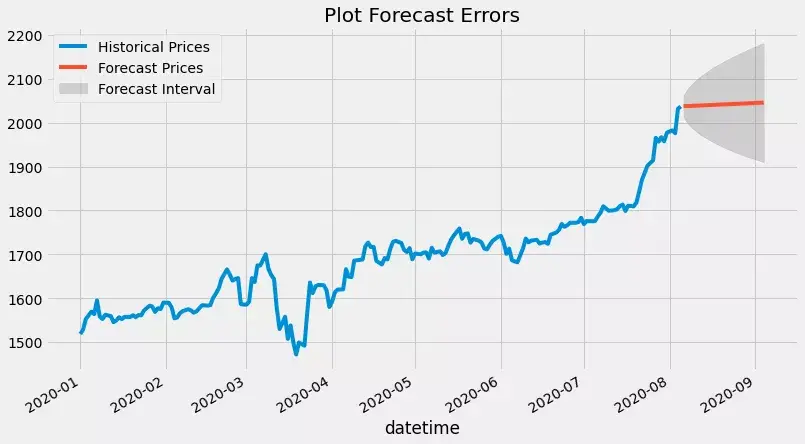
在机器学习领域,回归模型和时间序列模型用于预测,模型会同时生成预测误差(所谓置信区间),在可视化预测结果时,通常要求显示预测值和预测区间,这可以通过ax.plot()和ax.fill_between()实现。
接下来使用一个真实的案例说明,先从蜂鸟数据获取黄金价格,然后用ARIMA(自回归整合移动平均)预测未来30天的价格,可视化预测结果。
- # 从蜂鸟数据下载黄金价格
- params = {
- "symbol": "XAUUSD", # 现货黄金ID
- "start_date": "2010-01-01",
- "end_date": "2020-08-05",
- "apikey": os.getenv("TROCHIL_API") # 在蜂鸟数据官网注册获取API密钥
- }
- resp = requests.get("https://api.trochil.cn/v1/forex/history", params)
- data = pd.DataFrame.from_records(resp.json()["data"])
- data["datetime"] = pd.to_datetime(data["datetime"])
- data.set_index("datetime", inplace=True)
- # 创建ARMIA模型,预测未来30天价格走势
- model = ARIMA(data.close, order=(1, 1, 1))
- results = model.fit()
- fc, errors, conf = results.forecast(steps=30, alpha=0.05)
- fc_df = pd.DataFrame({
- "forecast": fc,
- "lower": conf[:, 0],
- "upper": conf[:, 1]
- }, index=pd.date_range("2020-08-06", periods=30))
- # 可视化预测结果,包括点预测值和预测区间
- # 预测区间包括置信下限和上限,代表真实值可能落入的范围
- # 调用ax.plot显示点预测值,ax.fill_between显示预测区间
- data_since_2020 = data["2020":]
- fig, ax = plt.subplots(figsize=(12, 7))
- data_since_2020.close.plot(ax=ax, label="Historical Prices")
- ax.plot(fc_df.index, fc_df.forecast, label="Forecast Prices")
- ax.fill_between(fc_df.index, fc_df.lower, fc_df.upper, color="gray", alpha=0.3, label="Forecast Interval")
- ax.set_title("Plot Forecast Errors")
- ax.legend(loc="upper left")
- <matplotlib.legend.Legend at 0x7fbfa348d9a0>


