- import pandas as pd
- import numpy as np
- import matplotlib.pyplot as plt
- import matplotlib
目的
- 对最基本的折线图plot做详细的解读,为绘制其他类型的图形打好基础。
plt.plot()的定义及调用
定义:
- plt.plot(*args, scalex=True, scaley=True, data=None, **kwargs)
调用:
- plot([x], y, [fmt], *, data=None, **kwargs)
- plot([x], y, [fmt], [x2], y2, [fmt2], ..., **kwargs)
位置参数:
- [x], y, [fmt]
关键字传参:
- *后面的参数
x序列的不同类型
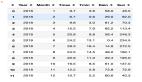
文本型的x序列
- # data
- X = [8,3,5,'t'] # 会按顺序【0,1,2,3】被定位在x轴的刻度上
- Y = [1,2,3,4]
- plt.plot(X,Y,marker = 'o',c='g')
- ax = plt.gca()
- print('x轴刻度:',plt.xticks()) #list
- xticklabels_lst = ax.get_xticklabels()
- print('-'*70)
x轴刻度:([0, 1, 2, 3], <a list of 4 Text xticklabel objects>)
----------------------------------------------------------------------
- print('x轴刻度标签:',list(xticklabels_lst)) #是个文本标签
x轴刻度标签:[Text(0, 0, '8'), Text(1, 0, '3'), Text(2, 0, '5'), Text(3, 0, 't')]
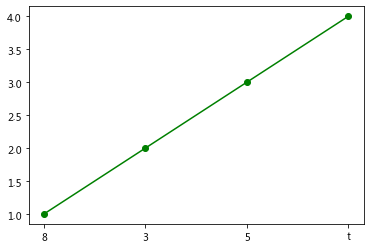
数字型的x序列
- # data
- X = [8,3,5,1] # 会按数字【8,3,5,1】被定位在x轴的刻度上
- Y = [1,2,3,4]
- plt.plot(X,Y,marker = 'o',c='g')
- ax = plt.gca()
- print('x轴刻度:',plt.xticks()) # array
- xticklabels_lst = ax.get_xticklabels()
- print('-'*70)
x轴刻度:(array([0., 1., 2., 3., 4., 5., 6., 7., 8., 9.]), <a list of 10 Text xticklabel objects>)
----------------------------------------------------------------------
- print('x轴刻度标签:',list(xticklabels_lst)) #是个按序号排列的文本标签
x轴刻度标签:[Text(0.0, 0, '0'), Text(1.0, 0, '1'), Text(2.0, 0, '2'), Text(3.0, 0, '3'), Text(4.0, 0, '4'), Text(5.0, 0, '5'), Text(6.0, 0, '6'), Text(7.0, 0, '7'), Text(8.0, 0, '8'), Text(9.0, 0, '9')]
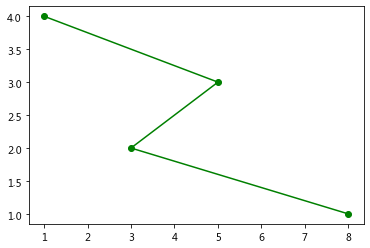
2种类型-2条线
- # data
- X1 = [8,3,5,'t']
- X2 = [8,3,5,1]
- Y = [1,2,3,4]
- plt.plot(X2,Y,marker = 'o',c='r')
- plt.plot(X1,Y,marker = 'o',c='g')
- ax = plt.gca()
- print('x轴刻度:',plt.xticks())
- xticklabels_lst = ax.get_xticklabels()
- print('-'*70)
x轴刻度:([0, 1, 2, 3], <a list of 4 Text xticklabel objects>)
----------------------------------------------------------------------
- print('x轴刻度标签:',list(xticklabels_lst))
x轴刻度标签:[Text(0, 0, '8'), Text(1, 0, '3'), Text(2, 0, '5'), Text(3, 0, 't')]
提供不同数量的位置参数
几种方式的调用
无参数
- #返回一个空列表
- plt.plot()
[]
plot([x], y, [fmt], *, data=None, **kwargs) plot([x], y, [fmt], [x2], y2, [fmt2], ..., **kwargs)
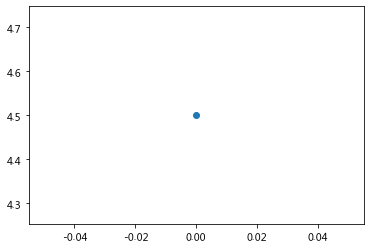
1个参数
- #提供一个数(点)
- plt.plot(4.5,marker='o')
[<matplotlib.lines.Line2D at 0x7f6f0352f978>]
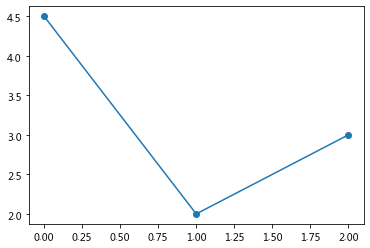
- #提供一个数字序列
- plt.plot([4.5,2,3],marker='o')
[<matplotlib.lines.Line2D at 0x7f6f0350d438>]
2个参数
自动解析位置参数的原则
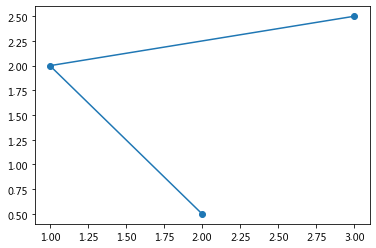
(x,y)形式
- # x/y 为序列
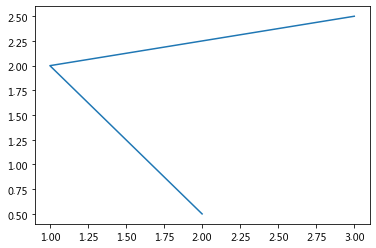
- plt.plot([2,1,3],[0.5,2,2.5],marker='o')
[<matplotlib.lines.Line2D at 0x7f6f034735c0>]
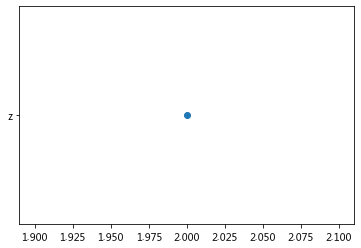
- # x/y 为标量
- plt.plot(2,['z'],marker = 'o')
[<matplotlib.lines.Line2D at 0x7f6f03461b38>]
(y,fmt)形式
- # plt.plot(2,'z',marker = 'o') #Unrecognized character z in format string
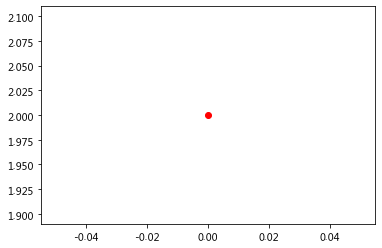
- # y 为标量
- plt.plot(2,'r',marker = 'o')
[<matplotlib.lines.Line2D at 0x7f6f033b7cf8>]
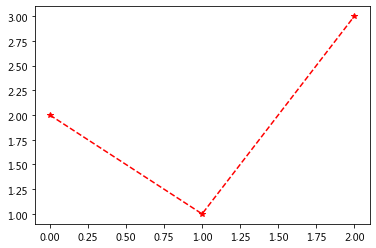
- # y 为序列
- plt.plot([2,1,3],'r--*')
[<matplotlib.lines.Line2D at 0x7f6f033a1cf8>]
3个参数
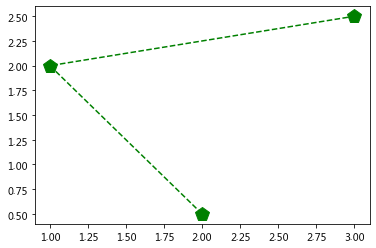
([x],y,[fmt])形式
- plt.plot([2,1,3],[0.5,2,2.5],'p--g',
- # marker='o'
- markersize = 15
- )
[<matplotlib.lines.Line2D at 0x7f6f0331e048>]
- # fmt不写,或者‘’,则使用默认样式
- plt.plot([2,1,3],[0.5,2,2.5],'',
- # marker='o'
- markersize = 15
- )
[<matplotlib.lines.Line2D at 0x7f6f03289390>]
绘图Line2D
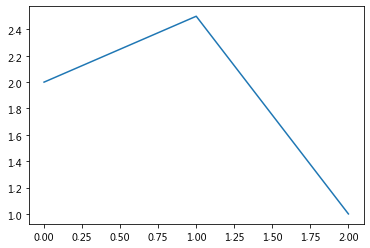
仅画线:绘图的默认情况
默认样式:蓝色的【线】【无标记】
- # marker = None 表示不做设置
- plt.plot([2,2.5,1])
[<matplotlib.lines.Line2D at 0x7f6f031f86a0>]
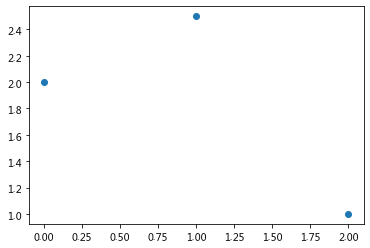
仅画标记
- plt.plot([2,2.5,1],'o')
[<matplotlib.lines.Line2D at 0x7f6f03afcba8>]
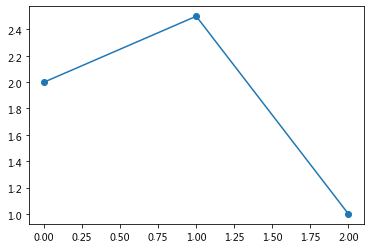
画线+标记
- plt.plot([2,2.5,1],'o-')
[<matplotlib.lines.Line2D at 0x7f6f031d62e8>]
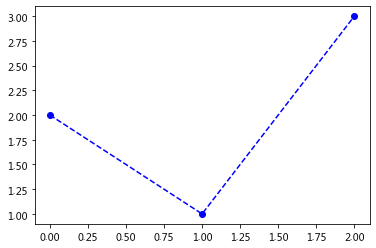
- plt.plot([2,1,3],'bo--')
[<matplotlib.lines.Line2D at 0x7f6f0317b128>]
fmt的组合顺序随意的?
6图合一及结论
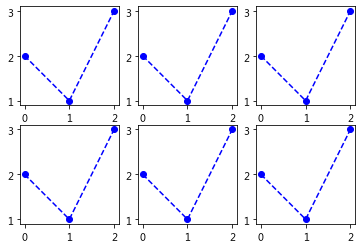
- # 6种组合
- # [color][marker][line],3种任意组合为6种可能
- # b :蓝色
- # o: 圆圈标记
- # --:虚线
- fmt = ['bo--','b--o','ob--','o--b','--bo','--ob']
- for i in range(len(fmt)):
- plt.subplot(2,3,i+1)
- plt.plot([2,1,3],fmt[i])
- # 结论:[color][marker][line],每个都是可选的,每个属性可以选择写或者不写
- # 而且与组合中它们所在的位置顺序无关
fmt支持的【线】-line
Line Styles
==== character description ====
'-' solid line style '--' dashed line style '-.' dash-dot line style ':' dotted line style
fmt支持的【标记】-marker
Markers
==== character description ====
'.' point marker ',' pixel marker \\\'o\\\' circle marker 'v' triangle_down marker '^' triangle_up marker '<' triangle_left marker '>' triangle_right marker '1' tri_down marker '2' tri_up marker '3' tri_left marker '4' tri_right marker 's\\\' square marker 'p' pentagon marker '*' star marker 'h' hexagon1 marker 'H' hexagon2 marker '+' plus marker 'x' x marker 'D' diamond marker 'd' thin_diamond marker '|' vline marker '_' hline marker
fmt支持的【颜色】-color
Colors
The supported color abbreviations are the single letter codes
==== character color ====
'b' blue 'g' green 'r' red 'c' cyan 'm' magenta 'y' yellow 'k' black 'w' white
所有样式:标记、线、颜色参考大全
链接:https://www.kesci.com/home/project/5ea4e5da105d91002d506ac6
样式属性
线条的属性
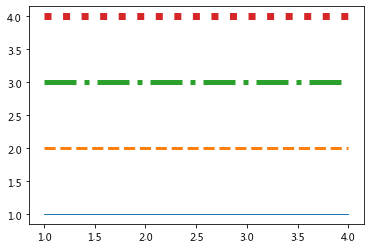
- # 包含:(颜色除外)
- # 线的样式、线的宽度
- # linestyle or ls: {'-', '--', '-.', ':', '', }
- # linewidth or lw: float
- ls_lst = ['-', '--', '-.', ':',]
- lw_lst = [1,3,5,7]
- for i in range(len(ls_lst)):
- plt.plot([1,2,3,4],[i+1]*4,ls_lst[i],lw = lw_lst[i])
标记的属性
- # 包含:
- '''
- marker: marker style
- #边框(颜色及边框粗细)
- markeredgecolor or mec: color
- markeredgewidth or mew: float
- #面颜色
- markerfacecolor or mfc: color
- markerfacecoloralt or mfcalt: color #备用标记颜色
- #标记的大小
- markersize or ms: float
- markevery: None or int or (int, int) or slice or List[int] or float or (float, float)
- '''
- # linestyle = None 表示不做设置,以默认值方式
- # linestyle = '' linestyle = 'none' 表示无格式,无线条
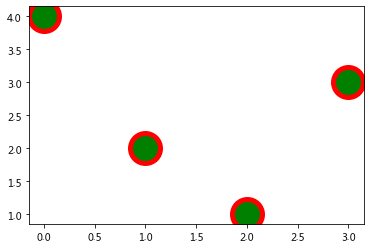
- plt.plot([4,2,1,3],linestyle = 'none',
- marker = 'o',
- markersize = 30,
- # edge
- markeredgecolor = 'r',
- markeredgewidth = 5,
- # face
- markerfacecolor = 'g',
- # markerfacecolor = 'none',
- # markerfacecolor = None,
- )
[<matplotlib.lines.Line2D at 0x7f6f02f085c0>]
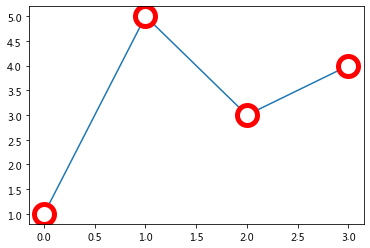
综合:带有空心圆标记的线条图
- '''
- 标记点是覆盖在线条的上面,位于上层
- 图层层次:[top] spines > marker > line > backgroud [bottom]
- spines:轴的4个边框
- spines 将线条图围在里面
- '''
- plt.plot([1,5,3,4],
- marker = 'o',
- markersize = 20,
- # edge
- markeredgecolor = 'r',
- markeredgewidth = 5,
- # face
- markerfacecolor = 'w', # 白色,与背景色相同,把线条覆盖着,营造空心的视觉效果
- # markerfacecolor = 'none', # 无色,透明,会看到线条
- # markerfacecolor = None, # 不设置,默认颜色
- )
- # markerfacecolor = ' ', # 无法识别
- # markerfacecolor = '', # 无法识别
[<matplotlib.lines.Line2D at 0x7f6f02e6e470>]
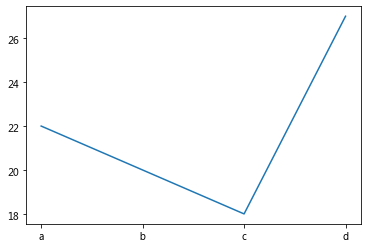
data关键字的使用
字典数据
- #字典数据
- d = {'name':list('abcd'),'age':[22,20,18,27]}
- plt.plot('name','age',ddata = d)
[<matplotlib.lines.Line2D at 0x7f6f02e52e48>]

DataFrame数据
- #DataFrame数据
- d = {'name':list('abcd'),'age':[22,20,18,27]}
- df = pd.DataFrame(d)
- df
| name | age | |
|---|---|---|
| 0 | a | 22 |
| 1 | b | 20 |
| 2 | c | 18 |
| 3 | d | 27 |
- plt.plot('name','age',data = df)
[<matplotlib.lines.Line2D at 0x7f6f02d7a940>]
总结
定义:
- plt.plot(*args,scalex = True,scaley = True,data = None ,**kwargs)
调用:
- plot([x], y, [fmt], *, data=None, **kwargs)
- plot([x], y, [fmt], [x2], y2, [fmt2], ..., **kwargs)
x,y,fmt均不能使用关键字传参
推荐使用:
- plt.plot(x,y,fmt)
- 多组数据时,再次调用
- plt.plot(x2,y2,fmt2) 画第2条线即可...
- 默认样式:蓝色的【线】+【无标记】,即无标记的线
- 可使用fmt来快捷控制线条的基本属性:颜色、线、标记
- [color][marker][line]
- fmt与关键字属性可混合使用,当两者有冲突时,以关键字的为准。
- 对于已有的带标签的数据如df,可使用
- plt.plot('columns_name1','columns_name2',data = df)