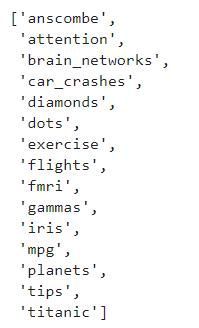
内置示例数据集
seaborn内置了十几个示例数据集,通过load_dataset函数可以调用。
其中包括常见的泰坦尼克、鸢尾花等经典数据集。
# 查看数据集种类
import seaborn as sns
sns.get_dataset_names()
- 1.
- 2.
- 3.
import seaborn as sns
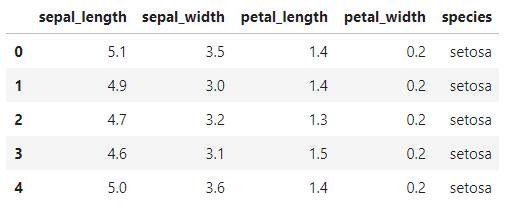
# 导出鸢尾花数据集
data = sns.load_dataset('iris')
data.head()
- 1.
- 2.
- 3.
- 4.
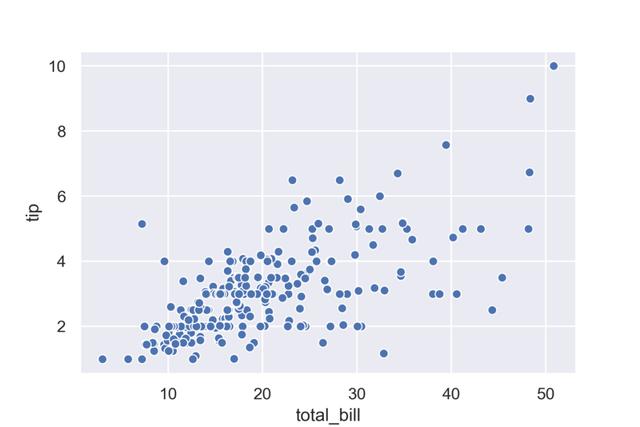
1. 散点图
函数sns.scatterplot
import seaborn as sns
sns.set()
import matplotlib.pyplot as plt
%matplotlib inline
# 小费数据集
tips = sns.load_dataset('tips')
ax = sns.scatterplot(x='total_bill',y='tip',data=tips)
plt.show()
- 1.
- 2.
- 3.
- 4.
- 5.
- 6.
- 7.
- 8.
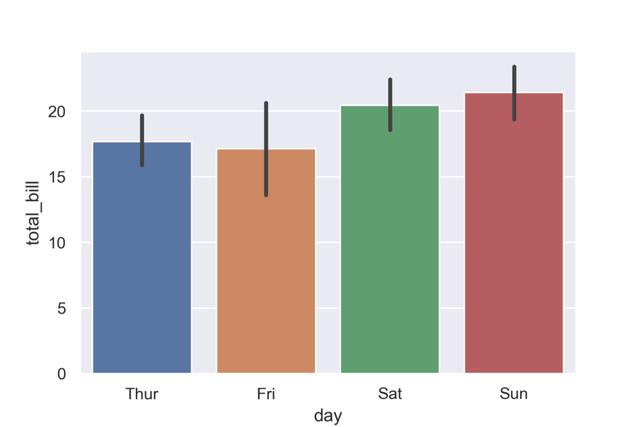
2. 条形图
函数sns.barplot
显示数据平均值和置信区间
import seaborn as sns
sns.set()
import matplotlib.pyplot as plt
%matplotlib inline
# 小费数据集
tips = sns.load_dataset("tips")
ax = sns.barplot(x="day", y="total_bill", data=tips)
plt.show()
- 1.
- 2.
- 3.
- 4.
- 5.
- 6.
- 7.
- 8.
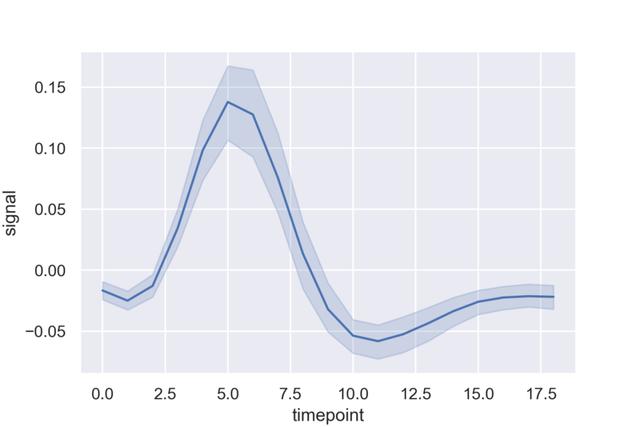
3. 线型图
函数sns.lineplot
绘制折线图和置信区间
import seaborn as sns
sns.set()
import matplotlib.pyplot as plt
%matplotlib inline
fmri = sns.load_dataset("fmri")
ax = sns.lineplot(x="timepoint", y="signal", data=fmri)
plt.show()
- 1.
- 2.
- 3.
- 4.
- 5.
- 6.
- 7.
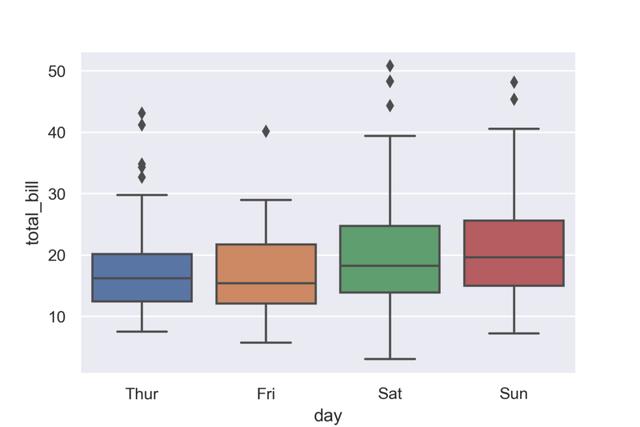
4. 箱线图
函数seaborn.boxplot
import seaborn as sns
sns.set()
import matplotlib.pyplot as plt
%matplotlib inline
tips = sns.load_dataset("tips")
ax = sns.boxplot(x="day", y="total_bill", data=tips)
plt.show()
- 1.
- 2.
- 3.
- 4.
- 5.
- 6.
- 7.
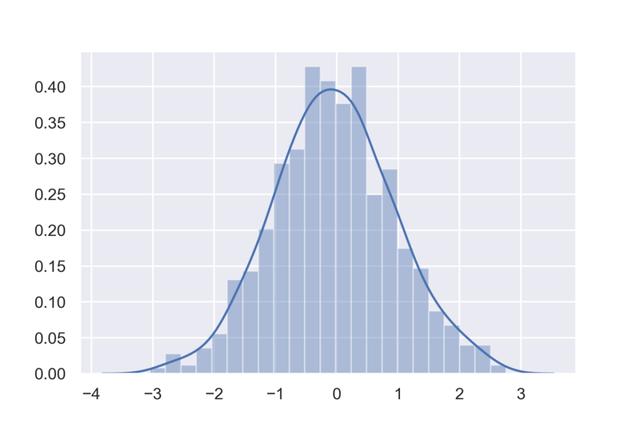
5. 直方图
函数seaborn.distplot
import seaborn as sns
import numpy as np
sns.set()
import matplotlib.pyplot as plt
%matplotlib inline
np.random.seed(0)
x = np.random.randn(1000)
ax = sns.distplot(x)
plt.show()
- 1.
- 2.
- 3.
- 4.
- 5.
- 6.
- 7.
- 8.
- 9.
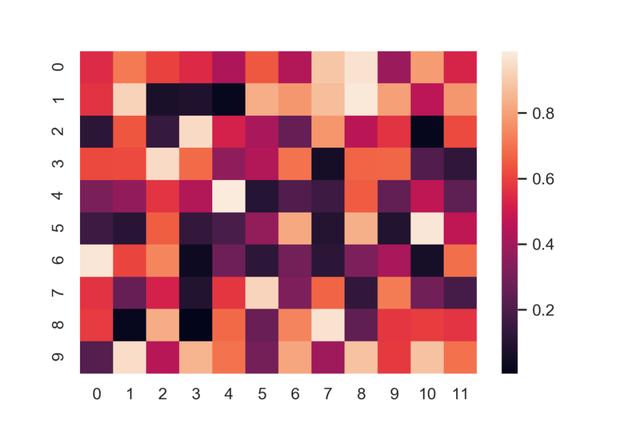
6. 热力图
函数seaborn.heatmap
import numpy as np
np.random.seed(0)
import seaborn as sns
sns.set()
import matplotlib.pyplot as plt
%matplotlib inline
uniform_data = np.random.rand(10, 12)
ax = sns.heatmap(uniform_data)
plt.show()
- 1.
- 2.
- 3.
- 4.
- 5.
- 6.
- 7.
- 8.
- 9.
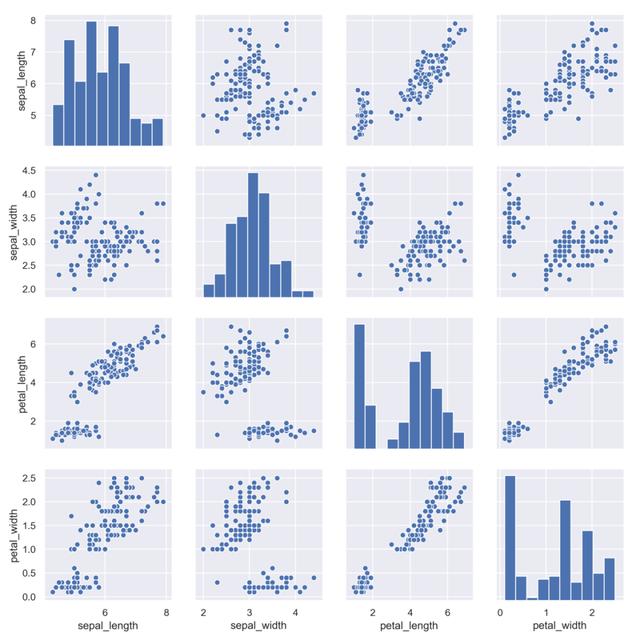
7. 散点图矩阵
函数sns.pairplot
import seaborn as sns
sns.set()
import matplotlib.pyplot as plt
%matplotlib inline
iris = sns.load_dataset("iris")
ax = sns.pairplot(iris)
plt.show()
- 1.
- 2.
- 3.
- 4.
- 5.
- 6.
- 7.
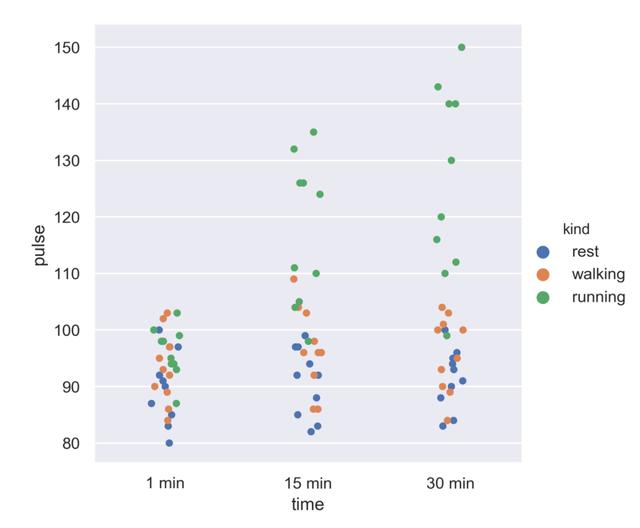
8. 分类散点图
函数seaborn.catplot
import seaborn as sns
sns.set()
import matplotlib.pyplot as plt
%matplotlib inline
exercise = sns.load_dataset("exercise")
ax = sns.catplot(x="time", y="pulse", hue="kind", data=exercise)\
plt.show()
- 1.
- 2.
- 3.
- 4.
- 5.
- 6.
- 7.
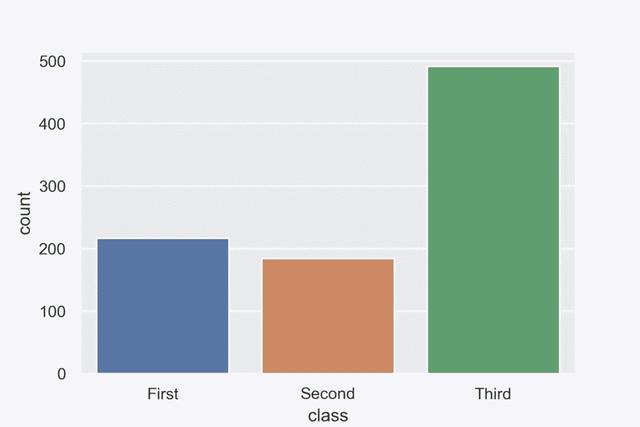
9. 计数条形图
函数seaborn.countplot
import seaborn as sns
sns.set()
import matplotlib.pyplot as plt
%matplotlib inline
titanic = sns.load_dataset("titanic")
ax = sns.countplot(x="class", data=titanic)
plt.show()
- 1.
- 2.
- 3.
- 4.
- 5.
- 6.
- 7.
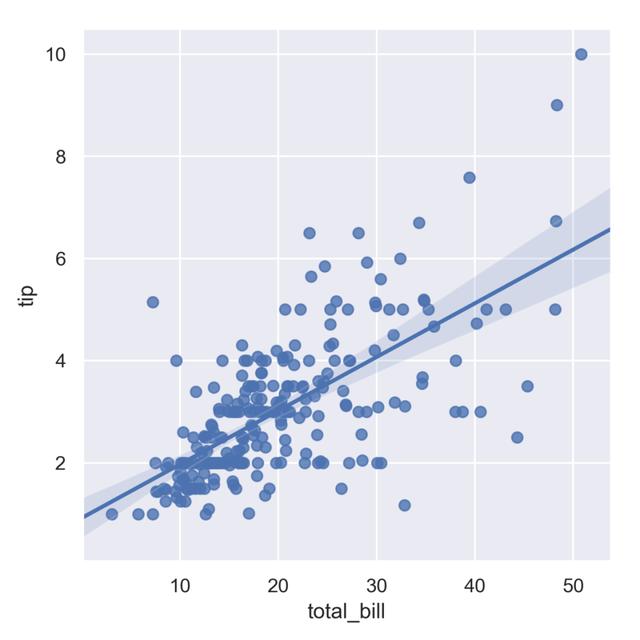
10. 回归图
函数 seaborn.lmplot
绘制散点及回归图
import seaborn as sns
sns.set()
import matplotlib.pyplot as plt
%matplotlib inline
tips = sns.load_dataset("tips")
ax = sns.lmplot(x="total_bill", y="tip", data=tips)

plt.show()
- 1.
- 2.
- 3.
- 4.
- 5.
- 6.
- 7.
- 8.