当前,数据可视化已经成为数据科学领域非常重要的一部分。不同网络系统中产生的数据,都需要经过适当的可视化处理,以便更好的呈现给用户读取和分析。
对任何一个组织来说,如果能够充分的获取数据、可视化数据和分析数据,那么就能很大程度上帮助了解数据产生的深层次原因,以便据此做出正确的决定。
对于前端开发人员来说,如果能够掌握交互式网页中的数据可视化技术,则是一项很棒的技能。当然,通过一些 JavaScript 的图表库也会使前端的数据可视化变得更加容易。使用这些库,开发者可以在无需考虑不同的语法所带来的编程难题的情况下,轻松实现将数据转化为易于理解的图表。
下面是挑选出的9个 JavaScript 图表库:
- Chart.js
- Chartist
- FlexChart
- Echarts
- NVD3
- C3.js
- TauCharts
- ReCharts
- Flot
Chart.js
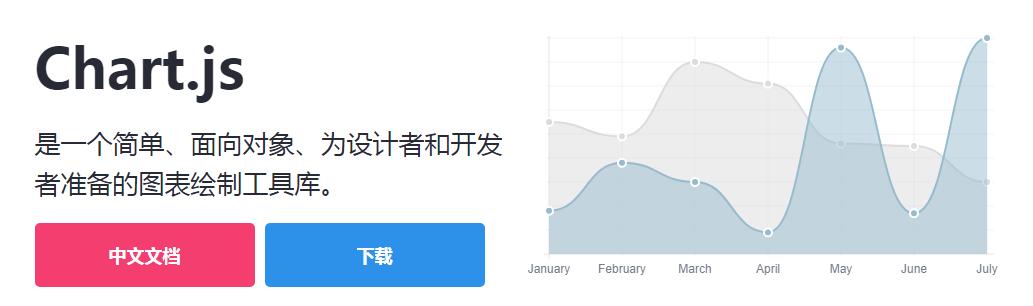
Chart.js 是一种简洁、用户友好的图表库,同时也是基于 HTML5 的 JavaScript 库,用于创建动画、交互式和可自定义的图表和图形。
借助 Chart.js,用户可以轻松直观地查看混合图表类型。默认情况下,也可以使用 Chart.js 创建响应式网页。
Chart.js 库允许用户快速创建可视化数据。Chart.js 易于设置,对初学者十分友好。使用 Chart.js 则不必考虑浏览器的兼容性问题,因为 Chart.js 支持旧浏览器。
使用 npm 安装 Chart.js:
- npm install chart.js --save
Chart.js 绘制雷达图的代码示例:
- const options = {
- scale: {
- // Hides the scale
- }
- };
- const data = {
- labels: ['Running', 'Swimming', 'Eating', 'Cycling'],
- datasets: [
- {
- data: [-10, -5, -3, -15],
- label: "two",
- borderColor: '#ffc63b'
- },
- {
- data: [10, 5, 3, 10],
- label: "three",
- borderColor: '#1d9a58'
- },
- {
- data: [18, 10, 4, 2],
- label: "one",
- borderColor: '#d8463c'
- },
- ]
- }
- const myRadarChart = new Chart(ctx, {
- data: data,
- type: 'radar',
- options: options
- });
Chartist
Chartist 库很适合于创建美观、响应能力强、阅读友好的图表。Chartist 使用 SVG 来呈现图表。
Chartist 还提供了使用 CSS 媒体查询和创意动画来自定义图表的能力。用户使用 Chartist 在图表设计中实现自己的所有创意。
Chartist 易于配置,也易于使用 Sass 进行定制。但是,它不支持旧浏览器。
使用 Chartist,可以通过 CSS 的样式来美化你的 SVG,用户完全可以现实自己所想的所有图表样式。
使用 npm 安装 Chartist:
- npm install chartist --save
Chartist 创建具有自定义标签的饼图的代码示例:
- var data = {
- labels: ['Bananas', 'Apples', 'Grapes'],
- series: [20, 15, 40]
- };
- var options = {
- labelInterpolationFnc: function(value) {
- return value[0]
- }
- };
- var responsiveOptions = [
- ['screen and (min-width: 640px)', {
- chartPadding: 30,
- labelOffset: 130,
- labelDirection: 'explode',
- labelInterpolationFnc: function(value) {
- return value;
- }
- }],
- ['screen and (min-width: 1024px)', {
- labelOffset: 80,
- chartPadding: 20
- }]
- ];
- new Chartist.Pie('.ct-chart', data, options, responsiveOptions);
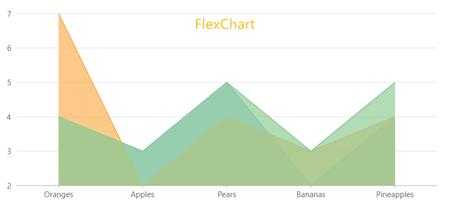
FlexChart 是高性能的图表工具。使用 FlexChart,可轻松的将表格数据可视化为业务图表。FlexChart 不但支持常见的图表类型,如折线图、饼状图、面积图等,还支持气泡图、K线图、条形图、漏斗图等高级图表类型。
FlexChart 的使用也十分简单,FlexChart 图表将所有与数据有关的任务都委托给 CollectionView 类,只需操作 CollectionView 类,就能实现过滤、排序和分组数据等功能。
FlexChart 包含的图表元素也比较全面,如图表图例、图表标题、图表页脚、数轴、图表 series 和标签等,用户也可以为图表添加自定义的元素,如平均线和趋势线等。
FlexChart 本质上是一种交互式的图表,不论是数据进行任何的更改,都会自动反应在图表上,如图表曲线随数据放大缩小、过滤、钻取、动画等。
查看 FlexChart 的中文学习指南和旭日图Demo。
FlexChart 绘制柱状图的代码示例:
- onload = function() {
- // wrap data in a CollectionView so the grid and chart
- // get notifications
- var data = new wijmo.collections.CollectionView(getData());
- // create the chart
- var theChart = new wijmo.chart.FlexChart('#theChart', {
- itemsSource: data,
- bindingX: 'country',
- series: [
- { binding: 'sales', name: 'Sales' },
- { binding: 'expenses', name: 'Expenses' },
- { binding: 'downloads', name: 'Downloads' }
- ]
- })
- // create a grid to show the data
- var theGrid = new wijmo.grid.FlexGrid('#theGrid', {
- itemsSource: data
- })
- // create some random data
- function getData() {
- var countries = 'US,Germany,UK,Japan,Italy,Greece'.split(','),
- data = [];
- for (var i = 0; i < countries.length; i++) {
- data.push({
- country: countries[i],
- sales: Math.random() * 10000,
- expenses: Math.random() * 5000,
- downloads: Math.round(Math.random() * 20000),
- });
- }
- return data;
- }
- }
Echarts
Echarts 是网页的数据可视化方面的一个非常有用的库。使用 Echarts,开发者可以创建直观的、可自定义的交互式图表,让数据的展示和分析变得十分容易。
由于 Echarts 是用普通的 JavaScript 编写的,所以 Echarts 不存在其它图表库存在的无法无缝迁移的问题。
同时,Echarts 也提供了很多官方文档供用户查看。
使用 npm 可以很容易的完成 Echarts 的安装:
- npm install echarts --save
Echarts 绘制散点图代码示例:
- var dom = document.getElementById("container");
- var myChart = echarts.init(dom);
- var app = {};
- option = null;
- option = {
- title: {
- text: 'Large-scale scatterplot'
- },
- tooltip : {
- trigger: 'axis',
- showDelay : 0,
- axisPointer:{
- show: true,
- type : 'cross',
- lineStyle: {
- type : 'dashed',
- width : 1
- }
- },
- zlevel: 1
- },
- legend: {
- data:['sin','cos']
- },
- toolbox: {
- show : true,
- feature : {
- mark : {show: true},
- dataZoom : {show: true},
- dataView : {show: true, readOnly: false},
- restore : {show: true},
- saveAsImage : {show: true}
- }
- },
- xAxis : [
- {
- type : 'value',
- scale:true
- }
- ],
- yAxis : [
- {
- type : 'value',
- scale:true
- }
- ],
- series : [
- {
- name:'sin',
- type:'scatter',
- large: true,
- symbolSize: 3,
- data: (function () {
- var d = [];
- var len = 10000;
- var x = 0;
- while (len--) {
- x = (Math.random() * 10).toFixed(3) - 0;
- d.push([
- x,
- //Math.random() * 10
- (Math.sin(x) - x * (len % 2 ? 0.1 : -0.1) * Math.random()).toFixed(3) - 0
- ]);
- }
- //console.log(d)
- return d;
- })()
- },
- {
- name:'cos',
- type:'scatter',
- large: true,
- symbolSize: 2,
- data: (function () {
- var d = [];
- var len = 20000;
- var x = 0;
- while (len--) {
- x = (Math.random() * 10).toFixed(3) - 0;
- d.push([
- x,
- //Math.random() * 10
- (Math.cos(x) - x * (len % 2 ? 0.1 : -0.1) * Math.random()).toFixed(3) - 0
- ]);
- }
- //console.log(d)
- return d;
- })()
- }
- ]
- };
- ;
- if (option && typeof option === "object") {
- myChart.setOption(option, true);
- }
NVD3
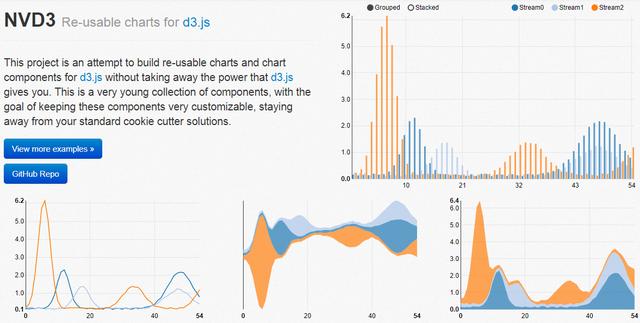
NVD3 是由 Mike Bostock 撰写的基于 D3 的 JavaScript 库。NVD3 允许用户在 Web 应用程序中创建美观的、可复用的图表。
NVD3 具有很强大的图表功能,能够很方便的创建箱形图、旭日形和烛台图等。如果用户想在 JavaScript 图表库中用到大量的能力,推荐试用 NVD3。
NVD3 图表库的速度有时可能会成为一个问题,与 Fastdom 安装配合使用,速度会更快。
NVD3 绘制简单的折线图代码示例:
- <pre style="box-sizing: inherit; font-family: Menlo, Monaco, Consolas, "Courier New", monospace; font-size: 16px; white-space: pre-wrap; overflow: auto; border-radius: 3px; padding: 2px; line-height: 1.4; word-wrap: normal; display: block; background: rgb(63, 63, 63); color: rgb(220, 220, 220); font-style: normal; font-variant-ligatures: normal; font-variant-caps: normal; font-weight: 400; letter-spacing: normal; orphans: 2; text-align: start; text-indent: 0px; text-transform: none; widows: 2; word-spacing: 0px; -webkit-text-stroke-width: 0px; text-decoration-style: initial; text-decoration-color: initial;">/*These lines are all chart setup. Pick and choose which chart features you want to utilize. */
- nv.addGraph(function() {
- var chart = nv.models.lineChart()
- .margin({left: 100}) //Adjust chart margins to give the x-axis some breathing room.
- .useInteractiveGuideline(true) //We want nice looking tooltips and a guideline!
- .transitionDuration(350) //how fast do you want the lines to transition?
- .showLegend(true) //Show the legend, allowing users to turn on/off line series.
- .showYAxis(true) //Show the y-axis
- .showXAxis(true) //Show the x-axis
- ;
- chart.xAxis //Chart x-axis settings
- .axisLabel('Time (ms)')
- .tickFormat(d3.format(',r'));
- chart.yAxis //Chart y-axis settings
- .axisLabel('Voltage (v)')
- .tickFormat(d3.format('.02f'));
- /* Done setting the chart up? Time to render it!*/
- var myData = sinAndCos(); //You need data...
- d3.select('#chart svg') //Select the <svg> element you want to render the chart in.
- .datum(myData) //Populate the <svg> element with chart data...
- .call(chart); //Finally, render the chart!
- //Update the chart when window resizes.
- nv.utils.windowResize(function() { chart.update() });
- return chart;
- });
- /**************************************
- * Simple test data generator
- */
- function sinAndCos() {
- var sin = [],sin2 = [],
- cos = [];
- //Data is represented as an array of {x,y} pairs.
- for (var i = 0; i < 100; i++) {
- sin.push({x: i, y: Math.sin(i/10)});
- sin2.push({x: i, y: Math.sin(i/10) *0.25 + 0.5});
- cos.push({x: i, y: .5 * Math.cos(i/10)});
- }
- //Line chart data should be sent as an array of series objects.
- return [
- {
- values: sin, //values - represents the array of {x,y} data points
- key: 'Sine Wave', //key - the name of the series.
- color: '#ff7f0e' //color - optional: choose your own line color.
- },
- {
- values: cos,
- key: 'Cosine Wave',
- color: '#2ca02c'
- },
- {
- values: sin2,
- key: 'Another sine wave',
- color: '#7777ff',
- area: true //area - set to true if you want this line to turn into a filled area chart.
- }
- ];
- }</pre>
C3.js
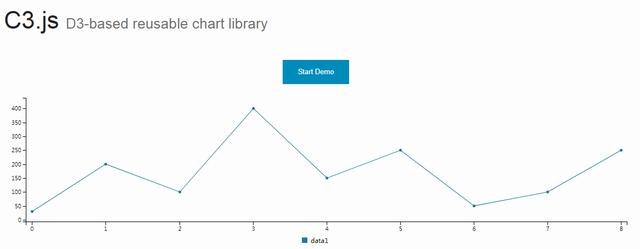
与 TauCharts 相同,C3.js 也是一个非常有效的基于 D3 的图表可视化库。另外,C3.js 允许用户创建可定制的具有个人风格的类。
C3.js 看起来是个比较难的库,但是一旦掌握了 C3.js 技巧,就能得心应手的使用了。
有了 C3.js 图表库,即使在***次渲染之后,用户也可以通过创建回调来更新图表。C3.js 也允许用户为自己的 Web 应用程序创建可复用的图表,从而减少工作量。
使用 npm 安装 C3.js 图表库:
npm install c3
C3.js 绘制组合图的代码示例:
- <pre style="box-sizing: inherit; font-family: Menlo, Monaco, Consolas, "Courier New", monospace; font-size: 16px; white-space: pre-wrap; overflow: auto; border-radius: 3px; padding: 2px; line-height: 1.4; word-wrap: normal; display: block; background: rgb(63, 63, 63); color: rgb(220, 220, 220); font-style: normal; font-variant-ligatures: normal; font-variant-caps: normal; font-weight: 400; letter-spacing: normal; orphans: 2; text-align: start; text-indent: 0px; text-transform: none; widows: 2; word-spacing: 0px; -webkit-text-stroke-width: 0px; text-decoration-style: initial; text-decoration-color: initial;">var chart = c3.generate({
- data: {
- columns: [
- ['data1', 30, 20, 50, 40, 60, 50],
- ['data2', 200, 130, 90, 240, 130, 220],
- ['data3', 300, 200, 160, 400, 250, 250],
- ['data4', 200, 130, 90, 240, 130, 220],
- ['data5', 130, 120, 150, 140, 160, 150],
- ['data6', 90, 70, 20, 50, 60, 120],
- ],
- type: 'bar',
- types: {
- data3: 'spline',
- data4: 'line',
- data6: 'area',
- },
- groups: [
- ['data1','data2']
- ]
- }
- });</pre>
TauCharts

TauCharts 是最灵活的 JavaScript 图表库之一。它是基于 D3 创建的,是一个以数据为中心的 JavaScript 图表库,可以改进数据可视化的效果。
TauCharts 十分灵活,访问其 API 也十分轻松。TauCharts 为用户提供了无缝映射和可视化的数据,使用 TauCharts 能够设计出十分美观的数据界面。同时,TauCharts 也和易于学习。
通过 npm 安装 TauCharts:
- npm install taucharts
TauCharts 绘制水平线的代码示例:
- <pre style="box-sizing: inherit; font-family: Menlo, Monaco, Consolas, "Courier New", monospace; font-size: 16px; white-space: pre-wrap; overflow: auto; border-radius: 3px; padding: 2px; line-height: 1.4; word-wrap: normal; display: block; background: rgb(63, 63, 63); color: rgb(220, 220, 220); font-style: normal; font-variant-ligatures: normal; font-variant-caps: normal; font-weight: 400; letter-spacing: normal; orphans: 2; text-align: start; text-indent: 0px; text-transform: none; widows: 2; word-spacing: 0px; -webkit-text-stroke-width: 0px; text-decoration-style: initial; text-decoration-color: initial;">var defData = [
- {"team": "d", "cycleTime": 1, "effort": 1, "count": 1, "priority": "low"}, {
- "team": "d",
- "cycleTime": 2,
- "effort": 2,
- "count": 5,
- "priority": "low"
- }, {"team": "d", "cycleTime": 3, "effort": 3, "count": 8, "priority": "medium"}, {
- "team": "d",
- "cycleTime": 4,
- "effort": 4,
- "count": 3,
- "priority": "high"
- }, {"team": "l", "cycleTime": 2, "effort": 1, "count": 1, "priority": "low"}, {
- "team": "l",
- "cycleTime": 3,
- "effort": 2,
- "count": 5,
- "priority": "low"
- }, {"team": "l", "cycleTime": 4, "effort": 3, "count": 8, "priority": "medium"}, {
- "team": "l",
- "cycleTime": 5,
- "effort": 4,
- "count": 3,
- "priority": "high"
- },
- {"team": "k", "cycleTime": 2, "effort": 4, "count": 1, "priority": "low"}, {
- "team": "k",
- "cycleTime": 3,
- "effort": 5,
- "count": 5,
- "priority": "low"
- }, {"team": "k", "cycleTime": 4, "effort": 6, "count": 8, "priority": "medium"}, {
- "team": "k",
- "cycleTime": 5,
- "effort": 8,
- "count": 3,
- "priority": "high"
- }];
- var chart = new tauCharts.Chart({
- data: defData,
- type: 'horizontalBar',
- x: 'effort',
- y: 'team',
- color:'priority'
- });
- chart.renderTo('#bar');</pre>
Recharts
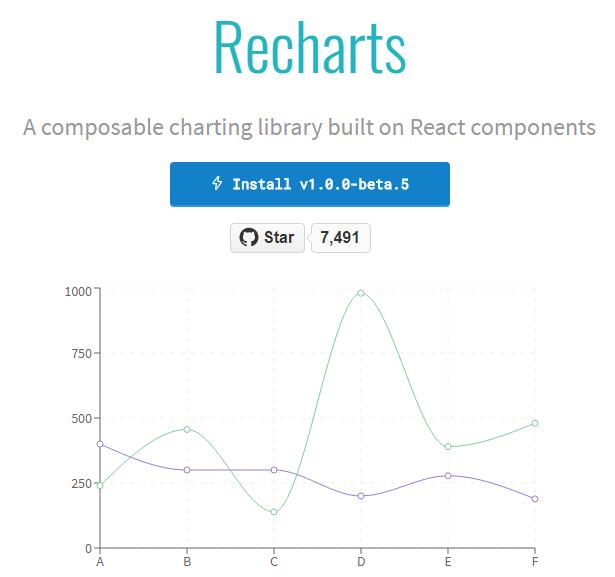
ReCharts 是一个使用 React 构建的,基于 D3 的图表库。
使用 ReCharts,用户可以在 React Web 应用程序中无缝地编写图表。
Recharts 非常轻巧,并使用 SVG 元素来创建很奇特的图表。
使用 npm 安装 Recharts:
- npm install recharts
Recharts 没有冗长的文档,它很直接。当你遇到困难时,使用 Recharts 可以很容易找到解决方案。
Recharts 创建自定义内容树图的代码示例:
- <pre style="box-sizing: inherit; font-family: Menlo, Monaco, Consolas, "Courier New", monospace; font-size: 16px; white-space: pre-wrap; overflow: auto; border-radius: 3px; padding: 2px; line-height: 1.4; word-wrap: normal; display: block; background: rgb(63, 63, 63); color: rgb(220, 220, 220); font-style: normal; font-variant-ligatures: normal; font-variant-caps: normal; font-weight: 400; letter-spacing: normal; orphans: 2; text-align: start; text-indent: 0px; text-transform: none; widows: 2; word-spacing: 0px; -webkit-text-stroke-width: 0px; text-decoration-style: initial; text-decoration-color: initial;">const {Treemap} = Recharts;
- const data = [
- {
- name: 'axis',
- children: [
- { name: 'Axes', size: 1302 },
- { name: 'Axis', size: 24593 },
- { name: 'AxisGridLine', size: 652 },
- { name: 'AxisLabel', size: 636 },
- { name: 'CartesianAxes', size: 6703 },
- ],
- },
- {
- name: 'controls',
- children: [
- { name: 'AnchorControl', size: 2138 },
- { name: 'ClickControl', size: 3824 },
- { name: 'Control', size: 1353 },
- { name: 'ControlList', size: 4665 },
- { name: 'DragControl', size: 2649 },
- { name: 'ExpandControl', size: 2832 },
- { name: 'HoverControl', size: 4896 },
- { name: 'IControl', size: 763 },
- { name: 'PanZoomControl', size: 5222 },
- { name: 'SelectionControl', size: 7862 },
- { name: 'TooltipControl', size: 8435 },
- ],
- },
- {
- name: 'data',
- children: [
- { name: 'Data', size: 20544 },
- { name: 'DataList', size: 19788 },
- { name: 'DataSprite', size: 10349 },
- { name: 'EdgeSprite', size: 3301 },
- { name: 'NodeSprite', size: 19382 },
- {
- name: 'render',
- children: [
- { name: 'ArrowType', size: 698 },
- { name: 'EdgeRenderer', size: 5569 },
- { name: 'IRenderer', size: 353 },
- { name: 'ShapeRenderer', size: 2247 },
- ],
- },
- { name: 'ScaleBinding', size: 11275 },
- { name: 'Tree', size: 7147 },
- { name: 'TreeBuilder', size: 9930 },
- ],
- },
- {
- name: 'layout',
- children: [
- { name: 'AxisLayout', size: 6725 },
- { name: 'BundledEdgeRouter', size: 3727 },
- { name: 'CircleLayout', size: 9317 },
- { name: 'CirclePackingLayout', size: 12003 },
- { name: 'DendrogramLayout', size: 4853 },
- { name: 'ForceDirectedLayout', size: 8411 },
- { name: 'IcicleTreeLayout', size: 4864 },
- { name: 'IndentedTreeLayout', size: 3174 },
- { name: 'Layout', size: 7881 },
- { name: 'NodeLinkTreeLayout', size: 12870 },
- { name: 'PieLayout', size: 2728 },
- { name: 'RadialTreeLayout', size: 12348 },
- { name: 'RandomLayout', size: 870 },
- { name: 'StackedAreaLayout', size: 9121 },
- { name: 'TreeMapLayout', size: 9191 },
- ],
- },
- { name: 'Operator', size: 2490 },
- { name: 'OperatorList', size: 5248 },
- { name: 'OperatorSequence', size: 4190 },
- { name: 'OperatorSwitch', size: 2581 },
- { name: 'SortOperator', size: 2023 },
- ],
- }
- ];
- const COLORS = ['#8889DD', '#9597E4', '#8DC77B', '#A5D297', '#E2CF45', '#F8C12D'];
- const CustomizedContent = React.createClass({
- render() {
- const { root, depth, x, y, width, height, index, payload, colors, rank, name } = this.props;
- return (
- <g>
- <rect
- x={x}
- y={y}
- width={width}
- height={height}
- style={{
- fill: depth < 2 ? colors[Math.floor(index / root.children.length * 6)] : 'none',
- stroke: '#fff',
- strokeWidth: 2 / (depth + 1e-10),
- strokeOpacity: 1 / (depth + 1e-10),
- }}
- />
- {
- depth === 1 ?
- <text
- x={x + width / 2}
- y={y + height / 2 + 7}
- textAnchor="middle"
- fill="#fff"
- fontSize={14}
- >
- {name}
- </text>
- : null
- }
- {
- depth === 1 ?
- <text
- x={x + 4}
- y={y + 18}
- fill="#fff"
- fontSize={16}
- fillOpacity={0.9}
- >
- {index + 1}
- </text>
- : null
- }
- </g>
- );
- }
- });
- const SimpleTreemap = React.createClass({
- render () {
- return (
- <Treemap
- width={400}
- height={200}
- data={data}
- dataKey="size"
- ratio={4/3}
- stroke="#fff"
- fill="#8884d8"
- content={<CustomizedContent colors={COLORS}/>}
- />
- );
- }
- })
- ReactDOM.render(
- <SimpleTreemap />,
- document.getElementById('container')
- );</pre>
Flot
目前,jQuery 已经成为 Web 开发人员非常重要的工具。有了 Flot.js,前端设计也变得更加容易。
Flot.js 是 JavaScript 库中较为古老的图表库之一。尽管如此,Flot.js 也不会因为绘制折线图、饼图、条形图、面积图、甚至堆叠图表而降低其性能。
Flot.js 有一个很完善的文档。当用户遇到困难时,可以很容易地找到解决办法。Flot.js 也支持旧版本的浏览器。
可以选择不使用 npm 来安装 Flot.js,而是在 HTML5 中包含 jQuery 和 JavaScript 文件。
Flot.js 的基本用法代码示例:
- <pre style="box-sizing: inherit; font-family: Menlo, Monaco, Consolas, "Courier New", monospace; font-size: 16px; white-space: pre-wrap; overflow: auto; border-radius: 3px; padding: 2px; line-height: 1.4; word-wrap: normal; display: block; background: rgb(63, 63, 63); color: rgb(220, 220, 220); font-style: normal; font-variant-ligatures: normal; font-variant-caps: normal; font-weight: 400; letter-spacing: normal; orphans: 2; text-align: start; text-indent: 0px; text-transform: none; widows: 2; word-spacing: 0px; -webkit-text-stroke-width: 0px; text-decoration-style: initial; text-decoration-color: initial;">$(function () {
- var d1 = [];
- for (var i = 0; i < 14; i += 0.5)
- d1.push([i, Math.sin(i)]);
- var d2 = [[0, 3], [4, 8], [8, 5], [9, 13]];
- // a null signifies separate line segments
- var d3 = [[0, 12], [7, 12], null, [7, 2.5], [12, 2.5]];
- $.plot($("#placeholder"), [ d1, d2, d3 ]);
- });</pre>
JavaScript 开发工具推荐
SpreadJS 纯前端表格控件是基于 HTML5 的 JavaScript 电子表格和网格功能控件,提供了完备的公式引擎、排序、过滤、输入控件、数据可视化、Excel 导入/导出等功能,适用于 .NET、Java 和移动端等各平台在线编辑类 Excel 功能的表格程序开发。
总结
以上介绍的 JavaScript 库都是高质量的图表库。但是在学习这些库的过程中,可能会因为学习曲线陡峭或是缺乏学习资料而遇到困难,一种很好的方案是将这些库结合起来使用。***也欢迎大家补充更多的 JavaScript 图表库。


 分享到微信
分享到微信  分享到微博
分享到微博
2020-10-09 09:44:25

2022-10-20 15:12:43


2012-04-17 09:44:08