MySQL存储过程、函数和触发器是应用程序开发人员的诱人构造。但是,正如我所发现的,使用MySQL存储例程会影响数据库性能。由于不能完全确定在客户访问期间看到了什么,我开始创建一些简单的测试来度量触发器对数据库性能的影响。结果可能会让你大吃一惊。
为什么存储例程在性能上不是***的:短版本?
最近,我与一位客户合作,了解触发器和存储例程的性能。我对存储例程的了解是:“死”代码(分支中的代码永远不会运行)仍然可以显著降低函数/过程/触发器的响应时间。我们需要小心地清理我们不需要的东西。
Profiling MySQL Stored Functions
Let's compare these four simple stored functions (in MySQL 5.7):
Function 1
- CREATE DEFINER=`root`@`localhost` FUNCTION `func1`() RETURNS int(11)
- BEGIN
- declare r int default 0;
- RETURN r;
- END
This function simply declares a variable and returns it. It is a dummy function.
Function 2
- CREATE DEFINER=`root`@`localhost` FUNCTION `func2`() RETURNS int(11)
- BEGIN
- declare r int default 0;
- IF 1=2
- THEN
- select levenshtein_limit_n('test finc', 'test func', 1000) into r;
- END IF;
- RETURN r;
- END
This function calls another function, levenshtein_limit_n (calculates levenshtein distance). But wait: this code will never run — the condition IF 1=2 will never be true. So that is the same as function 1.
Function 3
- CREATE DEFINER=`root`@`localhost` FUNCTION `func3`() RETURNS int(11)
- BEGIN
- declare r int default 0;
- IF 1=2 THEN
- select levenshtein_limit_n('test finc', 'test func', 1) into r;
- END IF;
- IF 2=3 THEN
- select levenshtein_limit_n('test finc', 'test func', 10) into r;
- END IF;
- IF 3=4 THEN
- select levenshtein_limit_n('test finc', 'test func', 100) into r;
- END IF;
- IF 4=5 THEN
- select levenshtein_limit_n('test finc', 'test func', 1000) into r;
- END IF;
- RETURN r;
- END
Here there are four conditions and none of these conditions will be true: there are 4 calls of "dead" code. The result of the function call for function 3 will be the same as function 2 and function 1.
Function 4
- CREATE DEFINER=`root`@`localhost` FUNCTION `func3_nope`() RETURNS int(11)
- BEGIN
- declare r int default 0;
- IF 1=2 THEN
- select does_not_exit('test finc', 'test func', 1) into r;
- END IF;
- IF 2=3 THEN
- select does_not_exit('test finc', 'test func', 10) into r;
- END IF;
- IF 3=4 THEN
- select does_not_exit('test finc', 'test func', 100) into r;
- END IF;
- IF 4=5 THEN
- select does_not_exit('test finc', 'test func', 1000) into r;
- END IF;
- RETURN r;
- END
This is the same as function 3, but the function we are running does not exist. Well, it does not matter as the selectdoes_not_exit will never run.
So, all the functions will always return 0. We expect that the performance of these functions will be the same or very similar. Surprisingly, that is not the case! To measure the performance, I used the "benchmark" function to run the same function 1M times. Here are the results:
- +-----------------------------+
- | benchmark(1000000, func1()) |
- +-----------------------------+
- | 0 |
- +-----------------------------+
- 1 row in set (1.75 sec)
- +-----------------------------+
- | benchmark(1000000, func2()) |
- +-----------------------------+
- | 0 |
- +-----------------------------+
- 1 row in set (2.45 sec)
- +-----------------------------+
- | benchmark(1000000, func3()) |
- +-----------------------------+
- | 0 |
- +-----------------------------+
- 1 row in set (3.85 sec)
- +----------------------------------+
- | benchmark(1000000, func3_nope()) |
- +----------------------------------+
- | 0 |
- +----------------------------------+
- 1 row in set (3.85 sec)
As we can see, func3 (with four dead code calls that will never be executed, otherwise identical to func1) runs almost 3x slower compared to func1(); func3_nope() is identical in terms of response time to func3().
Visualizing All System Calls From Functions
To figure out what is happening inside the function calls, I used performance_schema/sys schema to create a trace with ps_trace_thread() procedure.
1.Get the thread_id for the MySQL connection:
- mysql> select THREAD_ID from performance_schema.threads where processlist_id = connection_id();
- +-----------+
- | THREAD_ID |
- +-----------+
- | 49 |
- +-----------+
- 1 row in set (0.00 sec)
2.Run ps_trace_thread in another connection passing the thread_id=49:
- mysql> CALL sys.ps_trace_thread(49, concat('/var/lib/mysql-files/stack-func1-run1.dot'), 10, 0, TRUE, TRUE, TRUE);
- +--------------------+
- | summary |
- +--------------------+
- | Disabled 0 threads |
- +--------------------+
- 1 row in set (0.00 sec)
- +---------------------------------------------+
- | Info |
- +---------------------------------------------+
- | Data collection starting for THREAD_ID = 49 |
- +---------------------------------------------+
- 1 row in set (0.00 sec)
3.At that point I switched to the original connection (thread_id=49) and run:
- mysql> select func1();
- +---------+
- | func1() |
- +---------+
- | 0 |
- +---------+
- 1 row in set (0.00 sec)
4.The sys.ps_trace_thread collected the data (for 10 seconds, during which I ran the ), then it finished its collection and created the dot file:
- +-----------------------------------------------------------------------+
- | Info |
- +-----------------------------------------------------------------------+
- | Stack trace written to /var/lib/mysql-files/stack-func3nope-new12.dot |
- +-----------------------------------------------------------------------+
- 1 row in set (9.21 sec)
- +-------------------------------------------------------------------------------+
- | Convert to PDF |
- +-------------------------------------------------------------------------------+
- | dot -Tpdf -o /tmp/stack_49.pdf /var/lib/mysql-files/stack-func3nope-new12.dot |
- +-------------------------------------------------------------------------------+
- 1 row in set (9.21 sec)
- +-------------------------------------------------------------------------------+
- | Convert to PNG |
- +-------------------------------------------------------------------------------+
- | dot -Tpng -o /tmp/stack_49.png /var/lib/mysql-files/stack-func3nope-new12.dot |
- +-------------------------------------------------------------------------------+
- 1 row in set (9.21 sec)
- Query OK, 0 rows affected (9.45 sec)
I repeated these steps for all the functions above and then created charts of the commands.
Here are the results:
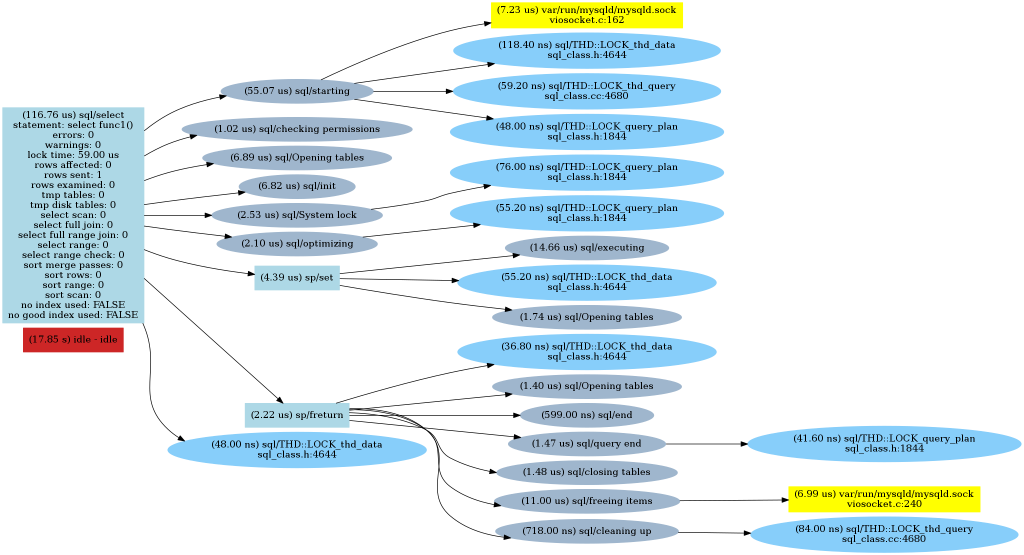
Func1()
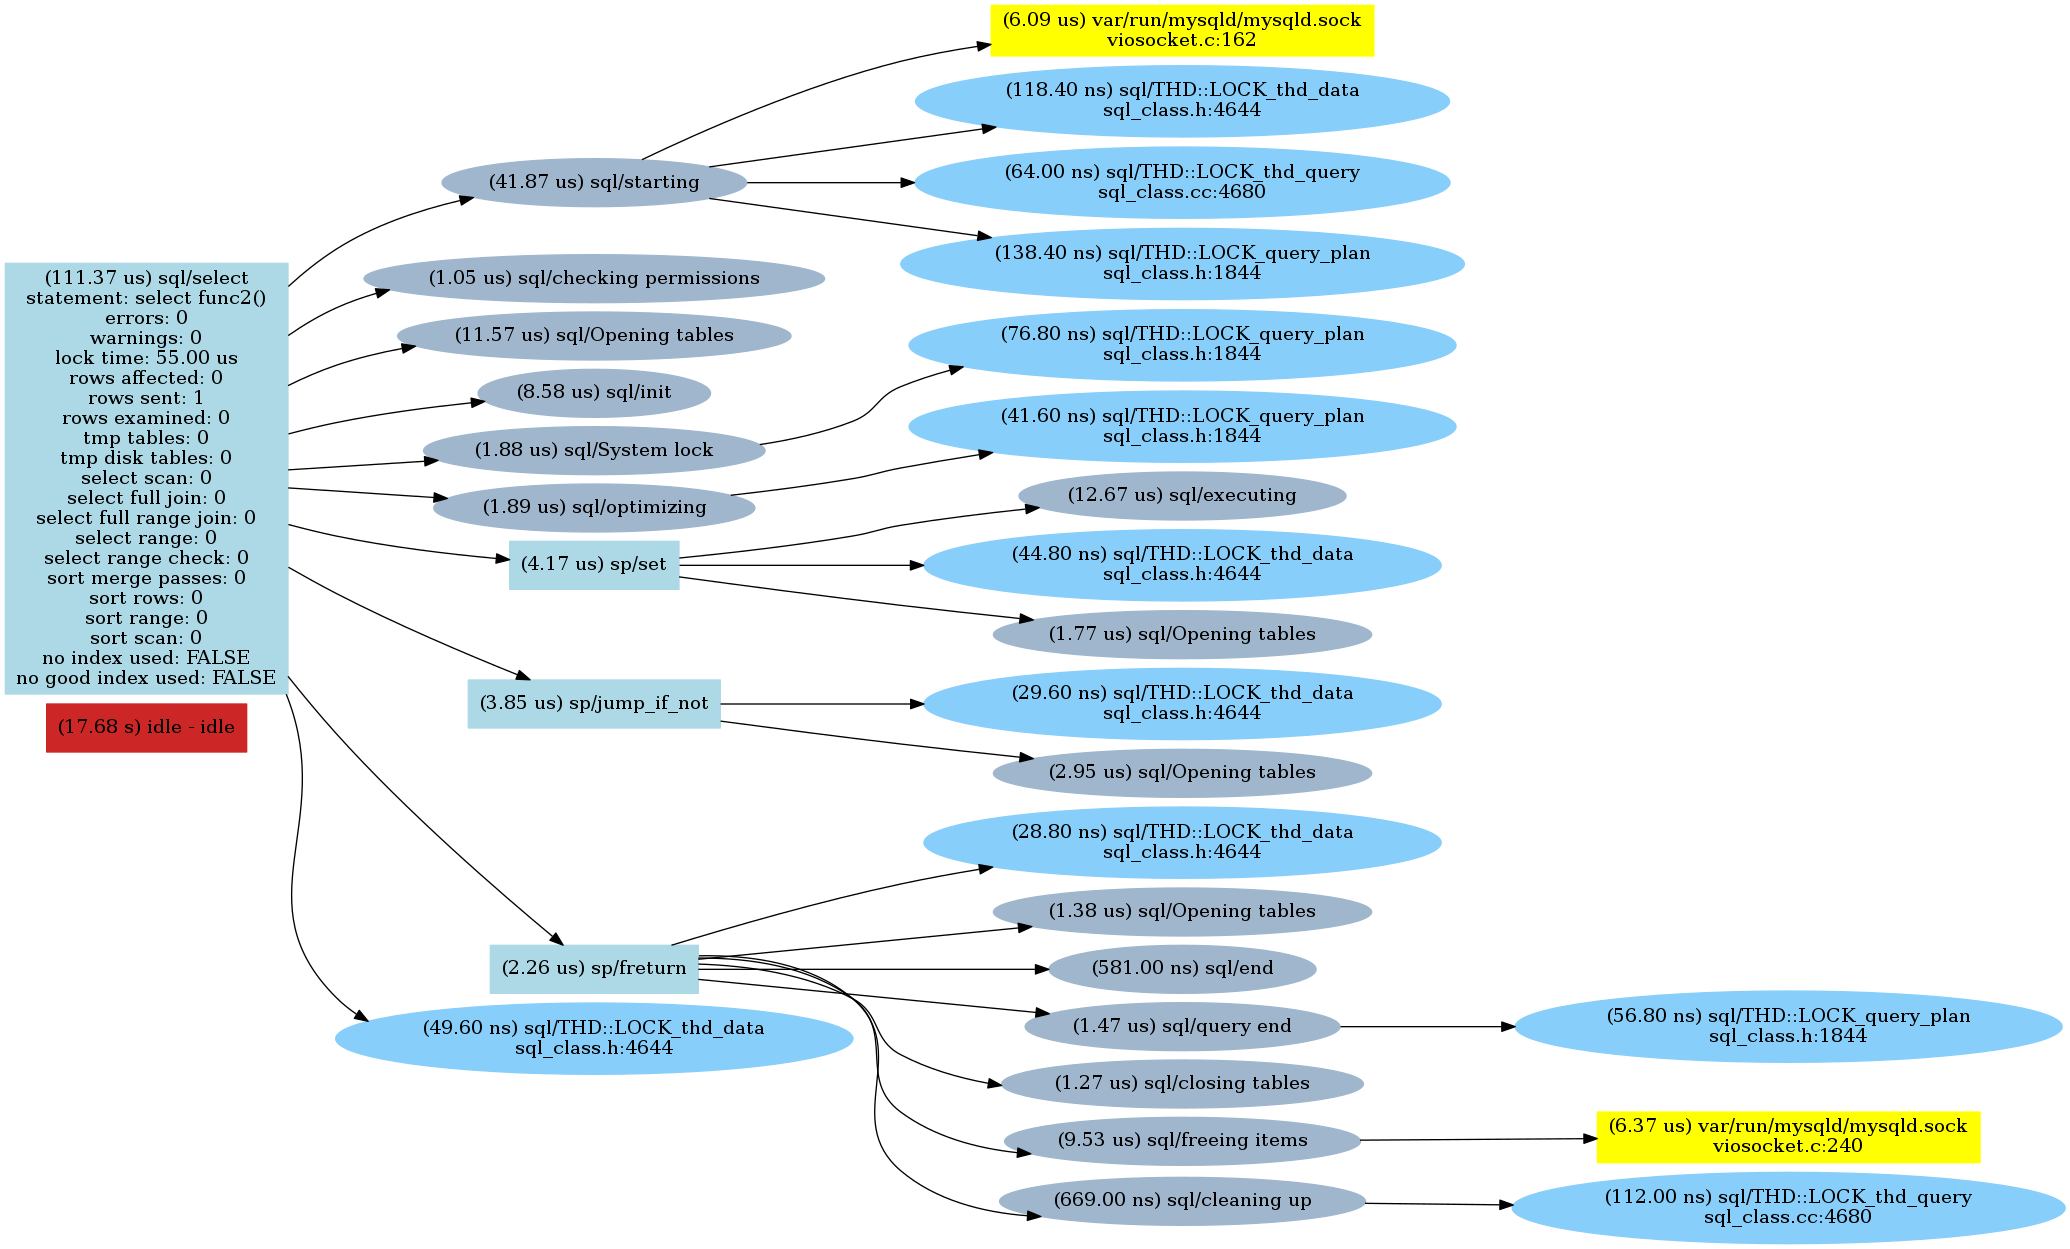
Func2()
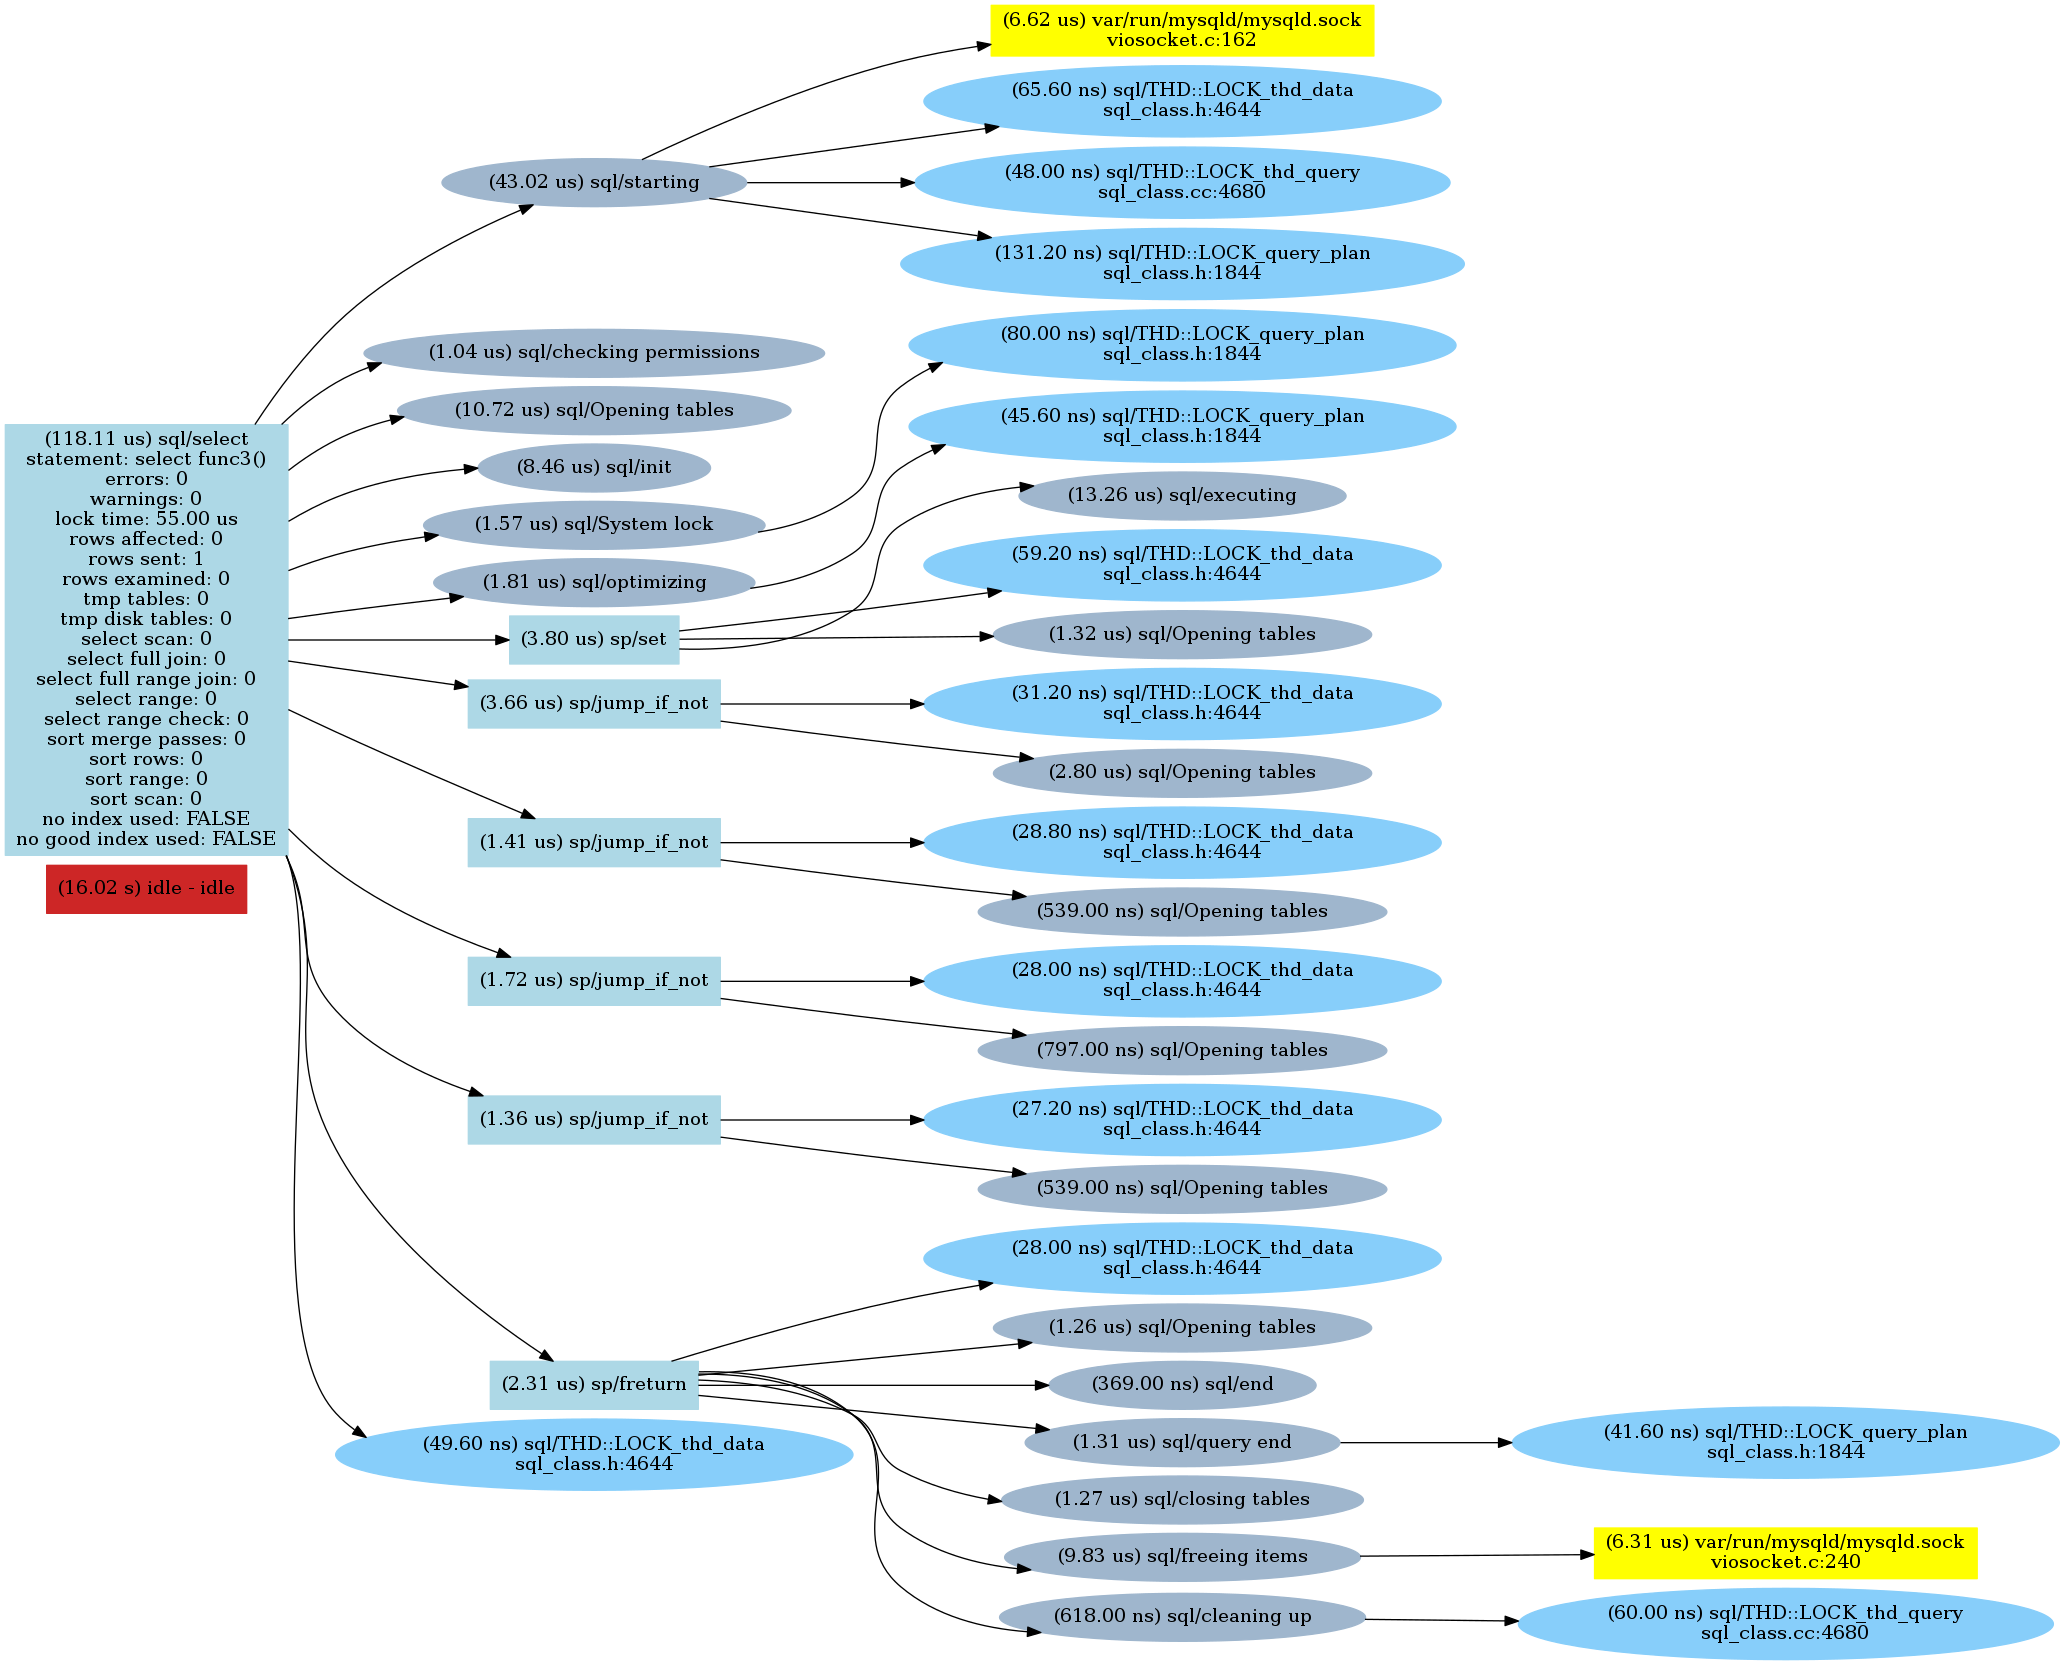
Func3()
As we can see, there is a sp/jump_if_not call for every "if" check followed by an opening tables statement (which is quite interesting). So parsing the "IF" condition made a difference.
For MySQL 8.0 we can also see MySQL source code documentation for stored routines which documents how it is implemented. It reads:
Flow Analysis OptimizationsAfter code is generated, the low level sp_instr instructions are optimized. The optimization focuses on two areas:
Dead code removal,Jump shortcut resolution.These two optimizations are performed together, as they both are a problem involving flow analysis in the graph that represents the generated code.
The code that implements these optimizations is sp_head::optimize().
However, this does not explain why it executes "opening tables." I have filed a bug.
When Slow Functions Actually Make a Difference
Well, if we do not plan to run one million of those stored functions, we will never even notice the difference. However, where it will make a difference is ... inside a trigger. Let's say that we have a trigger on a table: every time we update that table it executes a trigger to update another field. Here is an example: let's say we have a table called "form" and we simply need to update its creation date:
- mysql> update form set form_created_date = NOW() where form_id > 5000;
- Query OK, 65536 rows affected (0.31 sec)
- Rows matched: 65536 Changed: 65536 Warnings: 0
That is good and fast. Now we create a trigger which will call our dummy func1():
- CREATE DEFINER=`root`@`localhost` TRIGGER `test`.`form_AFTER_UPDATE`
- AFTER UPDATE ON `form`
- FOR EACH ROW
- BEGIN
- declare r int default 0;
- select func1() into r;
- END
Now repeat the update. Remember: it does not change the result of the update as we do not really do anything inside the trigger.
- mysql> update form set form_created_date = NOW() where form_id > 5000;
- Query OK, 65536 rows affected (0.90 sec)
- Rows matched: 65536 Changed: 65536 Warnings: 0
Just adding a dummy trigger will add 2x overhead: the next trigger, which does not even run a function, introduces a slowdown:
- CREATE DEFINER=`root`@`localhost` TRIGGER `test`.`form_AFTER_UPDATE`
- AFTER UPDATE ON `form`
- FOR EACH ROW
- BEGIN
- declare r int default 0;
- END
- mysql> update form set form_created_date = NOW() where form_id > 5000;
- Query OK, 65536 rows affected (0.52 sec)
- Rows matched: 65536 Changed: 65536 Warnings: 0
Now, lets use func3 (which has "dead" code and is equivalent to func1):
- CREATE DEFINER=`root`@`localhost` TRIGGER `test`.`form_AFTER_UPDATE`
- AFTER UPDATE ON `form`
- FOR EACH ROW
- BEGIN
- declare r int default 0;
- select func3() into r;
- END
- mysql> update form set form_created_date = NOW() where form_id > 5000;
- Query OK, 65536 rows affected (1.06 sec)
- Rows matched: 65536 Changed: 65536 Warnings: 0
However, running the code from the func3 inside the trigger (instead of calling a function) will speed up the update:
- CREATE DEFINER=`root`@`localhost` TRIGGER `test`.`form_AFTER_UPDATE`
- AFTER UPDATE ON `form`
- FOR EACH ROW
- BEGIN
- declare r int default 0;
- IF 1=2 THEN
- select levenshtein_limit_n('test finc', 'test func', 1) into r;
- END IF;
- IF 2=3 THEN
- select levenshtein_limit_n('test finc', 'test func', 10) into r;
- END IF;
- IF 3=4 THEN
- select levenshtein_limit_n('test finc', 'test func', 100) into r;
- END IF;
- IF 4=5 THEN
- select levenshtein_limit_n('test finc', 'test func', 1000) into r;
- END IF;
- END
- mysql> update form set form_created_date = NOW() where form_id > 5000;
- Query OK, 65536 rows affected (0.66 sec)
- Rows matched: 65536 Changed: 65536 Warnings: 0
Memory Allocation
Potentially, even if the code will never run, MySQL will still need to parse the stored routine-or trigger-code for every execution, which can potentially lead to a memory leak, as described in this bug.
结论
存储的例程和触发器事件在执行时被解析。即使是永远不会运行的“死”代码也会显著影响批量操作的性能(例如,在触发器中运行时)。这也意味着通过设置“标志”(例如)禁用触发器仍然会影响批量操作的性能。


