简介
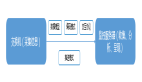
集合可视化我们用得最多的是韦恩图,韦恩图在集合数少的时候是很好用的,但是当集合数多比如五个以上的时候那就会看花眼了,比如下面这副含有6个集合韦恩图,是发表在Nature上的文章里的,漂亮是漂亮,但是眼都快看花了。

今天介绍一个R包UpSetR,专门用来集合可视化,来源于UpSet,Python里面也有一个相似的包py-upset。此外还有个UpSetR shiny app以及源代码。
安装
两种方式安装:
#从CRAN安装
install.packages("UpSetR")
#从Github上安装
devtools::install_github("hms-dbmi/UpSetR")
- 1.
- 2.
- 3.
- 4.
数据导入
UpSetR提供了两个函数fromList以及fromExpression将数据转换为UpsetR适用的数据格式。
#fromList
listinput <- list(one = c(1, 2, 3, 5, 7, 8, 11, 12, 13), two = c(1, 2, 4, 5,

10), three = c(1, 5, 6, 7, 8, 9, 10, 12, 13))

#fromExpression

expressionInput <- c(one = 2, two = 1, three = 2, `one&two` = 1, `one&three` = 4,

`two&three` = 1, `one&two&three` = 2)
- 1.
- 2.
- 3.
- 4.
- 5.
- 6.
- 7.
- 8.
- 9.
- 10.
接下来就可以绘制绘制图形了
library(UpSetR)
upset(fromList(listinput), order.by = "freq")
#下面绘制的图形等同于上图
upset(fromExpression(expressionInput), order.by = "freq")
- 1.
- 2.
- 3.
- 4.

参数详解
下面所有的例子都将使用UpSetR内置的数据集movies来绘制。
#导入数据
movies <- read.csv(system.file("extdata", "movies.csv", package = "UpSetR"), header = TRUE, sep = ";")
#先大致浏览一下该数据集,数据集太长,就只看前几列
knitr::kable(head(movies[,1:10]))
- 1.
- 2.
- 3.
- 4.

该数据集展示的是电影名(name)、发行时间(ReleaseDate)以及电影类型,多了去了就不详讲了,自个可以看去。
UpsetR绘制集合可视化图形使用函数upset()。
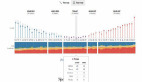
upset(movies, nsets = 6, number.angles = 30, point.size = 2, line.size = 1, mainbar.y.label = "Genre Intersections", sets.x.label = "Movies Per Genre", text.scale = c(1.3, 1.3, 1, 1, 1.5, 1))
- 1.

解释一下上面部分参数:
- nsets: 顾名思义,就是展示几个集合,movies数据集由20几个集合,不可能全部展示,另外从图中可以看出,这6个集合应该不是按顺序选择的。
- numble.angle: 柱子上的数字看到了吧,这个参数就是调整数字角度的,可有可无的
- mainbar.y.label/sets.x.label:坐标轴名称
- text.scale(): 有六个数字,分别控制c(intersection size title, intersection size tick labels, set size title, set size tick labels, set names, numbers above bars)。
很多时候我们想要看特定的几个集合,UpSetR满足我们的需求。
upset(movies, sets = c("Action", "Adventure", "Comedy", "Drama", "Mystery",
"Thriller", "Romance", "War", "Western"), mb.ratio = c(0.55, 0.45), order.by = "freq")
- 1.
- 2.

文中的参数:
- mb.ratio: 控制上方条形图以及下方点图的比例
- order.by: 如何排序,这里freq表示从大到小排序展示,其他选项有degree以及先按freq再按degree排序。
各个变量也可以通过参数keep.order来排序
upset(movies, sets = c("Action", "Adventure", "Comedy", "Drama", "Mystery",
"Thriller", "Romance", "War", "Western"), mb.ratio = c(0.55, 0.45), order.by = "freq",
keep.order = TRUE)
- 1.
- 2.
- 3.

也可以按group进行展示,这图展示的就是按各个变量自身、两个交集、三个交集…依次展示。参数cutoff控制每个group显示几个交集。
参数intersects控制总共显示几个交集。
upset(movies, nintersects = 70, group.by = "sets", cutoff = 7)
- 1.

还有很多参数比如控制颜色的参数,点、线大小等,具体可查看?upset
queries参数
queries参数分为四个部分:query, param, color, active.
- query: 指定哪个query,UpSetR有内置的,也可以自定义,说到底就是一个查询函数
- param: list, query作用于哪个交集
- color:每个query都是一个list,里面可以设置颜色,没设置的话将调用包里默认的调色板
- active:被指定的条形图是否需要颜色覆盖,TRUE的话显示颜色,FALSE的话则在条形图顶端显示三角形
内置的intersects query
upset(movies, queries = list(list(query=intersects, params=list("Drama", "Comedy", "Action"), color="orange", active=T),
list(query=intersects, params=list("Drama"), color="red", active=F),
list(query=intersects, params=list("Action", "Drama"), active=T)))
- 1.
- 2.
- 3.

内置的elements query
此query可以可视化特定交集在不同条件下的情况
upset(movies, queries = list(list(query=elements, params=list("AvgRating", 3.5, 4.1), color="blue", active=T),
list(query=elements, params=list("ReleaseDate", 1980, 1990, 2000), color="red", active=F)))
- 1.
- 2.

自定义一个query
myfunc <- function(row, release, rating){
newdata <- (row["ReleaseDate"]%in%release)&(row["AvgRating"]>rating)
}
upset(movies, queries = list(list(query=myfunc, params=list(c(1950,1960,1990,2000), 3.0), color="red", active=T)))
- 1.
- 2.
- 3.
- 4.

添加query图例
upset(movies, query.legend = "top", queries = list(list(query = intersects,
params = list("Drama", "Comedy", "Action"), color = "orange", active = T,
query.name = "Funny action"), list(query = intersects, params = list("Drama"),
color = "red", active = F), list(query = intersects, params = list("Action",
"Drama"), active = T, query.name = "Emotional action")))
- 1.
- 2.
- 3.
- 4.
- 5.

参数attribute.plots
主要是用于添加属性图,内置有柱形图、散点图、热图等
柱形图
upset(movies, main.bar.color = "black", queries = list(list(query = intersects,
params = list("Drama"), active = T)), attribute.plots = list(gridrows = 50,
plots = list(list(plot = histogram, x = "ReleaseDate", queries = F), list(plot = histogram,
x = "AvgRating", queries = T)), ncols = 2))
- 1.
- 2.
- 3.
- 4.

散点图
upset(movies, main.bar.color = "black", queries = list(list(query = intersects,
params = list("Drama"), color = "red", active = F), list(query = intersects,
params = list("Action", "Drama"), active = T), list(query = intersects,
params = list("Drama", "Comedy", "Action"), color = "orange", active = T)),
attribute.plots = list(gridrows = 45, plots = list(list(plot = scatter_plot,
x = "ReleaseDate", y = "AvgRating", queries = T), list(plot = scatter_plot,
x = "AvgRating", y = "Watches", queries = F)), ncols = 2), query.legend = "bottom")
- 1.
- 2.
- 3.
- 4.
- 5.
- 6.
- 7.

箱线图
箱线图可以展示数据的分布,通过参数boxplot.summary控制,最多可以一次性显示两个箱线图
upset(movies, boxplot.summary = c("AvgRating", "ReleaseDate"))
- 1.

还有一个十分重要的功能Incorporating Set Metadata这里就不讲了。
SessionInfo
sessionInfo()
## R version 3.4.2 (2017-09-28)
## Platform: x86_64-w64-mingw32/x64 (64-bit)
## Running under: Windows 10 x64 (build 15063)
##
## Matrix products: default
##
## locale:
## [1] LC_COLLATE=Chinese (Simplified)_China.936
## [2] LC_CTYPE=Chinese (Simplified)_China.936
## [3] LC_MONETARY=Chinese (Simplified)_China.936
## [4] LC_NUMERIC=C
## [5] LC_TIME=Chinese (Simplified)_China.936
##
## attached base packages:
## [1] stats graphics grDevices utils datasets methods base
##
## other attached packages:
## [1] UpSetR_1.3.3
##
## loaded via a namespace (and not attached):
## [1] Rcpp_0.12.13 knitr_1.17 magrittr_1.5 munsell_0.4.3
## [5] colorspace_1.3-2 rlang_0.1.2 stringr_1.2.0 highr_0.6
## [9] plyr_1.8.4 tools_3.4.2 grid_3.4.2 gtable_0.2.0
## [13] htmltools_0.3.6 yaml_2.1.14 lazyeval_0.2.0 rprojroot_1.2
## [17] digest_0.6.12 tibble_1.3.4 gridExtra_2.3 ggplot2_2.2.1
## [21] evaluate_0.10.1 rmarkdown_1.6 labeling_0.3 stringi_1.1.5
## [25] compiler_3.4.2 scales_0.5.0 backports_1.1.1
- 1.
- 2.
- 3.
- 4.
- 5.
- 6.
- 7.
- 8.
- 9.
- 10.
- 11.
- 12.
- 13.
- 14.
- 15.
- 16.
- 17.
- 18.
- 19.
- 20.
- 21.
- 22.
- 23.
- 24.
- 25.
- 26.
- 27.
- 28.