本文介绍几款Linux运维比较实用的工具,希望对Linux管理员有所帮助。
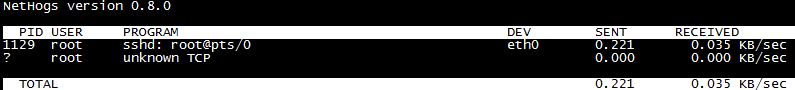
1、查看进程占用带宽情况-Nethogs
Nethogs 是一个终端下的网络流量监控工具可以直观的显示每个进程占用的带宽。
下载:http://sourceforge.net/projects/nethogs/files/nethogs/0.8/nethogs-0.8.0.tar.gz/download
- [root@localhost ~]#yum -y install libpcap-devel ncurses-devel
- [root@localhost ~]# tar zxvf nethogs-0.8.0.tar.gz
- [root@localhost ~]# cd nethogs
- [root@localhost nethogs]# make && make install
- [root@localhost nethogs]# nethogs eth0
2、硬盘读取性能测试-IOZone
IOZone是一款Linux文件系统性能测试工具 可以测试不同的操作系统中文件系统的读写性能。
下载:http://www.iozone.org/src/current/
- [root@localhost current]# tar xvf iozone3_420.tar
- [root@localhost ~]# cd iozone3_420/src/current/
- [root@localhost current]# make linux
- [root@localhost current]# ./iozone -a -n 512m -g 16g -i 0 -i 1 -i 5 -f /mnt/iozone -Rb ./iozone.xls
- -a使用全自动模式
- -n为自动模式设置最小文件大小(Kbytes)。
- -g设置自动模式可使用的最大文件大小Kbytes。
- -i用来指定运行哪个测试。
- -f指定测试文件的名字完成后自动删除
- -R产生Excel到标准输出
- -b指定输出到指定文件上
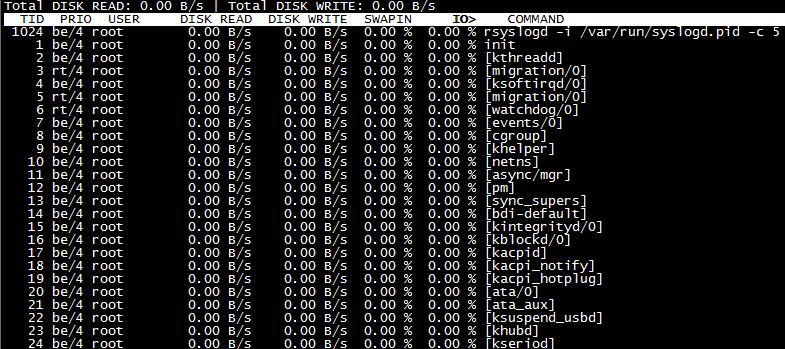
3、实时监控磁盘IO-IOTop
IOTop命令是专门显示硬盘IO的命令,界面风格类似top命令。
- [root@localhost ~]# yum -y install iotop
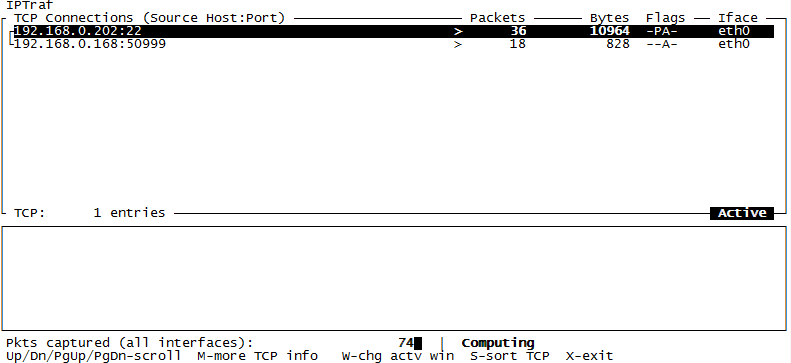
4、网络流量监控-IPtraf
IPtraf是一个运行在Linux下的简单的网络状况分析工具。
- [root@localhost ~]# yum -y install iptraf
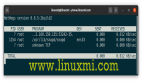
5、网络流量监控-IFTop
iftop是类似于linux下面top的实时流量监控工具。比iptraf直观些。
下载:http://www.ex-parrot.com/~pdw/iftop/
- [root@localhost ~]# tar zxvf iftop-0.17.tar.gz
- [root@localhost ~]# cd iftop-0.17
- [root@localhost iftop-0.17]# ./configure
- [root@localhost iftop-0.17]# make && make install
- [root@localhost iftop-0.17]# iftop
- [root@localhost iftop-0.17]# iftop -i eth0 #指定监控网卡接口
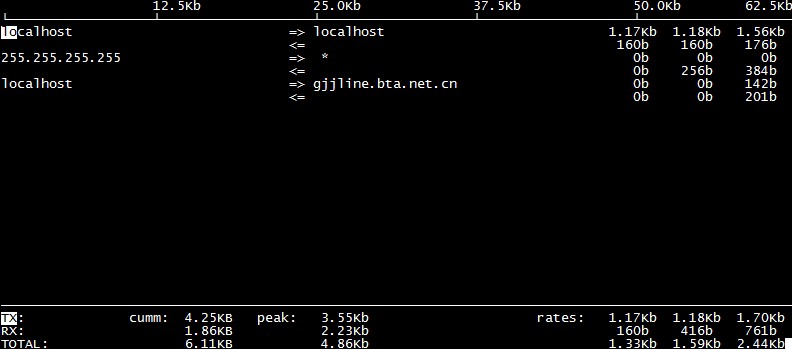
- TX:发送流量
- RX:接收流量
- TOTAL:总流量
- Cumm:运行iftop到目前时间的总流量
- peak:流量峰值
- rates:分别表示过去 2s 10s 40s 的平均流量
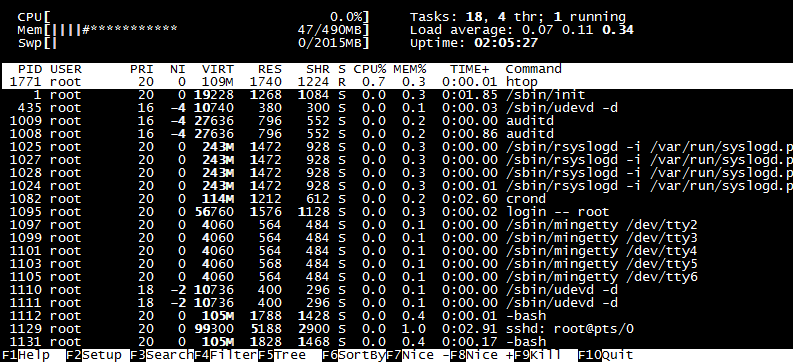
6、进程实时监控-HTop
HTop是一个 Linux 下的交互式的进程浏览器可以用来替换Linux下的top命令。
rpm -ivh http://pkgs.repoforge.org/rpmforge-release/rpmforge-release-0.5.2-2.el6.rf.x86_64.rpm(安装第三方YUM源)
- [root@localhost ~]# yum -y install htop
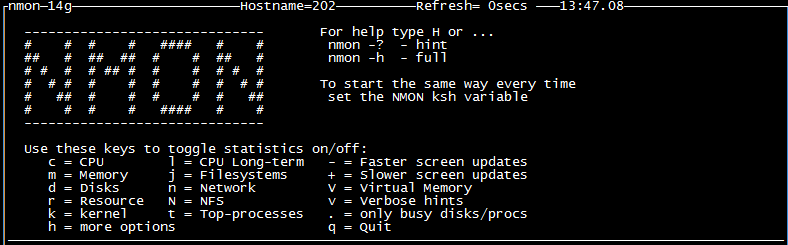
7、系统资源监控-NMON
NMON是一种在AIX与各种Linux操作系统上广泛使用的监控与分析工具
下载:http://sourceforge.jp/projects/sfnet_nmon/releases/
- [root@localhost ~]# chmod +x nmon_x86_64_rhel6
- [root@localhost ~]# mv nmon_x86_64_rhel6 /usr/sbin/nmon
- [root@localhost ~]# nmon
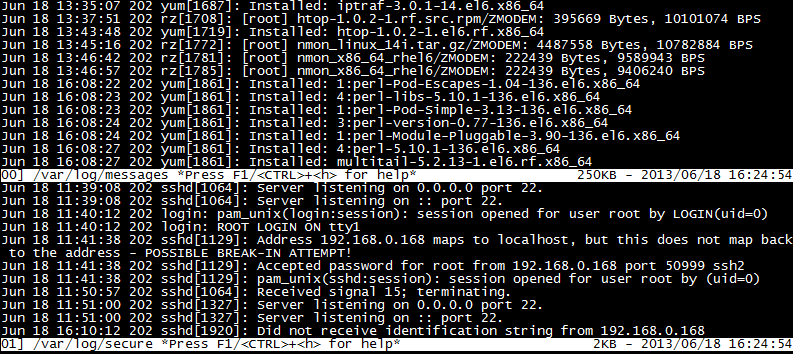
8、监控多个日志-MultiTail
MultiTail是在控制台打开多个窗口用来实现同时监控多个日志文档、类似tail命令的功能的软件。
rpm -ivh http://pkgs.repoforge.org/rpmforge-release/rpmforge-release-0.5.2-2.el6.rf.x86_64.rpm (安装第三方YUM源)
- [root@localhost ~]# yum -y install multitail
- [root@localhost ~]# multitail -e "fail" /var/log/secure #筛选关键字进行监控
- [root@localhost ~]# multitail -l "ping baidu.com" #监控后面的命令-l将要执行的命令
- [root@localhost ~]# multitail -i /var/log/messages -i /var/log/secure #-i指定一个文件名
9、SSH暴力破解防护-Fail2ban
Fail2ban可以监视你的系统日志然后匹配日志的错误信息正则式匹配执行相应的屏蔽动作一般情况下是调用防火墙屏蔽
下载:http://www.fail2ban.org/wiki/index.php/Downloads
- [root@localhost ~]# cd fail2ban-0.8.11
- [root@localhost fail2ban-0.8.11]# python setup.py install
- [root@localhost fail2ban-0.8.11]# cd files/
- [root@localhost files]# cp ./redhat-initd /etc/init.d/fail2ban
- [root@localhost files]# service fail2ban start
- [root@localhost files]# chkconfig --add fail2ban
- [root@localhost files]# chkconfig fail2ban on
注:需要配置iptables实用,如果重启iptables了也要重启fail2ban,因为fail2ban的原理是调用iptables实时阻挡外界的攻击。
- [root@localhost ~]# grep -v "^#" /etc/fail2ban/jail.conf | grep -v "^$"
- [DEFAULT]
- ignoreip = 127.0.0.1/8#忽略本机IP
- bantime = 600 #符合规则后封锁时间
- findtime = 600 #在多长时间内符合规则执行封锁如600秒达到3次则执行
- maxretry = 3 #最大尝试次数
- backend = auto #日志修改检测日志gamin、polling和auto这三种
- usedns = warn
- [ssh-iptables]
- enabled = true#默认是禁用false
- filter = sshd
- action = iptables[name=SSH, port=ssh, protocol=tcp]
- # sendmail-whois[name=SSH,dest=收件人邮箱, sender=发件人邮箱, sendername="Fail2Ban"]
- logpath = /var/log/sshd.log #响应的错误日志一般在/var/log/secure
- maxretry = 5 #尝试错误次数覆盖全局中的maxretry
注:默认所有的应用防护都是关闭的,需要我们手动开启。fail2ban.conf文件是日志信息,jail.conf文件是保护的具体服务和动作配置信息。
- [root@localhost ~]# touch /var/log/sshd.log
- [root@localhost ~]# service fail2ban restart
- [root@localhost ~]# fail2ban-client status #查看监控已经开启
- Status
- |- Number of jail: 1
- `- Jail list: ssh-iptables
- [root@localhost ~]# iptables -L #iptables过滤表有fail2ban一条规则
- fail2ban-SSH tcp -- anywhere anywhere tcp dpt:ssh
10、连接会话终端持续化-Tmux
Tmux是一个优秀的终端复用软件类似GNU Screen比Screen更加方面、灵活和高效。为了确保连接SSH时掉线不影响任务运行。
rpm -ivh http://pkgs.repoforge.org/rpmforge-release/rpmforge-release-0.5.2-2.el6.rf.x86_64.rpm(安装第三方YUM源)
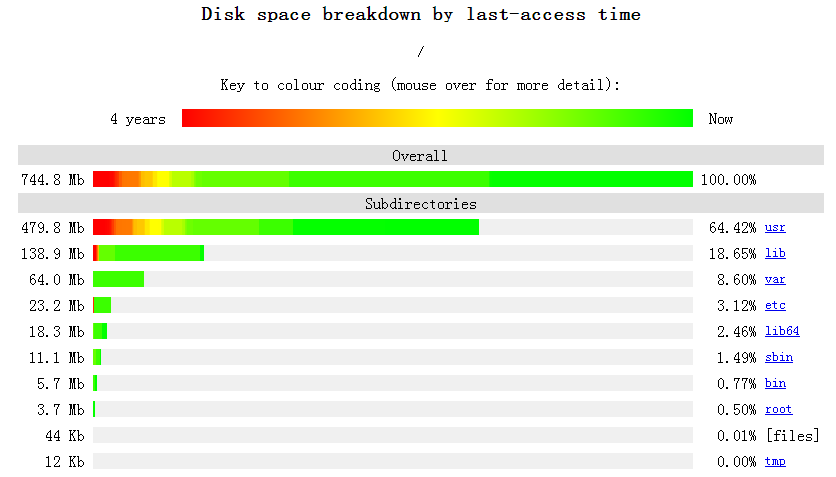
11、页面显示磁盘空间使用情况-Agedu
下载:http://www.chiark.greenend.org.uk/~sgtatham/agedu/
- [root@localhost ~]# tar zxvf agedu-r9723.tar.gz
- [root@localhost ~]# cd agedu-r9723
- [root@localhost ~]# ./configure
- [root@localhost ~]# make && make install
- [root@localhost ~]# agedu -s / #-s扫描
- [root@localhost ~]# agedu -w --address 192.168.0.10:80 #-w输入一个网页链接
- [root@localhost ~]# agedu -w --address 192.168.0.108080 --auth none #--auth关闭认证如果不加端口号会生成一个随机的用浏览器访问
12、安全扫描工具-NMap
NMap是Linux下的网络连接扫描和嗅探工具包用来扫描网上电脑开放的网络连接端。
下载:http://nmap.org/download.html
- [root@localhost ~]# tar jxvf nmap-6.40.tar.bz2
- [root@localhost nmap-6.40]# ./configure
- [root@localhost nmap-6.40]# make && make install
- [root@localhost ~]# nmap 192.168.0.10 #获取基本信息
- [root@localhost ~]# nmap -O 192.168.0.10 #获取系统版本信息
- [root@localhost ~]# nmap -A 192.168.0.10 #获取系统综合信息
- [root@localhost ~]# nmap 192.168.0.0/24 #获取一个网段工作设备基本信息
- -sSTCP扫描
- -sV系统版本检测
13、Web压力测试-Httperf
Httperf比ab更强大,能测试出web服务能承载的最大服务量及发现潜在问题;比如:内存使用、稳定性。最大优势:可以指定规律进行压力测试,模拟真实环境。
下载:http://code.google.com/p/httperf/downloads/list
- [root@localhost ~]# tar zxvf httperf-0.9.0.tar.gz
- [root@localhost ~]# cd httperf-0.9.0
- [root@localhost httperf-0.9.0]# ./configure
- [root@localhost httperf-0.9.0]# make && make install
- [root@localhost ~]# httperf --hog --server=192.168.0.202 --uri=/index.html --num-conns=10000 --wsess=10,10,0.1
参数说明:
--hog:让httperf尽可能多产生连接,httperf会根据硬件配置,有规律的产生访问连接
--num-conns:连接数量,总发起10000请求
--wsess: 用户打开网页时间规律模拟,第一个10表示产生10个会话连接,第二个10表示每个会话连接进行10次请求,0.1表示每个会话连接请求之间的间隔时间/s
本文出自 “求知无坦途,学问无捷径!” 博客