使用Nagios监控网页
1. Nagios监控问题的由来
对于一个网站来说,外部用户能够看到就是该网站的页面。网站页面能否被正常访问,以及显示是否正常势必会成为网站整体水平最直接的外在表现。
那么,如何才能在***时间检测到网页是否正常,并且给相应的技术人员发出报警来及时解决问题,而不是等接到用户抱怨的电话后才在慌忙中仓促的解决问题呢?解决这个问题的关键就是要在***时间发现问题,发现那些不能显示的网页或是显示不正常的网页,并及时发出报警。当然我们可以通过人工的方法去监测,但对于一些大型的、复杂的网站来说就不是很合适了,我们可以使用监控软件来解决这个问题。我所使用的就是Nagios软件,它提供的插件(Plugins)中有相应的命令可以完成对网页的监控。
2. 如何通过Nagios解决此类问题
对于Nagios、NRPE以及Nagios Plugins的安装配置网站的资料很多,在我的Blog中也有相应的文章可以参考,在这里就不再过多的说明了。
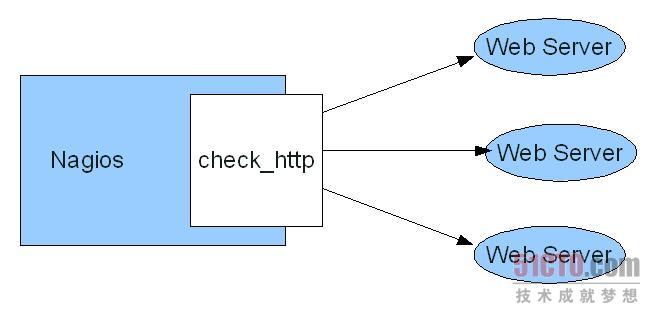
想使用Nagios监控网页状况,Nagios插件中的一个命令不得不被提及,那就是check_http,我没可以使用它来检查网页是否正常、可用。该命令的具体说明和用法如下。
  Usage: check_http -H | -I [-u ] [-p ]

  [-w ] [-c ] [-t ] [-L]

  [-a auth] [-f ] [-e ]

  [-s string] [-l] [-r | -R ] [-P string]

  [-m :] [-4|-6] [-N] [-M ] [-A string]

  [-k string] [-S] [-C ] [-T ]

  NOTE: One or both of -H and -I must be specified

  Options:

  -h, --help

  Print detailed help screen

  -V, --version

  Print version information

  -H, --hostname=ADDRESS

  Host name argument for servers using host headers (virtual host)

  Append a port to include it in the header (eg: example.com:5000)

  -I, --IP-address=ADDRESS

  IP address or name (use numeric address if possible to bypass DNS lookup).

  -p, --port=INTEGER

  Port number (default: 80)

  -4, --use-ipv4

  Use IPv4 connection

  -6, --use-ipv6

  Use IPv6 connection

  -S, --ssl

  Connect via SSL. Port defaults to 443

  -C, --certificate=INTEGER

  Minimum number of days a certificate has to be valid. Port defaults to 443

  (when this option is used the url is not checked.)

  -e, --expect=STRING

  String to expect in first (status) line of server response (default:

  HTTP/1.)

  If specified skips all other status line logic (ex: 3xx, 4xx, 5xx processing)

  -s, --string=STRING

  String to expect in the content

  -u, --url=PATH

  URL to GET or POST (default: /)

  -P, --post=STRING

  URL encoded http POST data

  -N, --no-body

  Don’t wait for document body: stop reading after headers.

  (Note that this still does an HTTP GET or POST, not a HEAD.)

  -M, --max-age=SECONDS

  Warn if document is more than SECONDS old. the number can also be of

  the form "10m" for minutes, "10h" for hours, or "10d" for days.

  -T, --content-type=STRING

  specify Content-Type header media type when POSTing

  -l, --linespan

  Allow regex to span newlines (must precede -r or -R)

  -r, --regex, --ereg=STRING

  Search page for regex STRING

  -R, --eregi=STRING

  Search page for case-insensitive regex STRING

  --invert-regex

  Return CRITICAL if found, OK if not

  -a, --authorization=AUTH_PAIR

  Username:password on sites with basic authentication

  -A, --useragent=STRING

  String to be sent in http header as "User Agent"

  -k, --header=STRING

  Any other tags to be sent in http header. Use multiple times for additional headers

  -L, --link

  Wrap output in HTML link (obsoleted by urlize)

  -f, --onredirect=

  How to handle redirected pages

  -m, --pagesize=INTEGER<:INTEGER>

  Minimum page size required (bytes) : Maximum page size required (bytes)

  -w, --warning=DOUBLE

  Response time to result in warning status (seconds)

  -c, --critical=DOUBLE

  Response time to result in critical status (seconds)

  -t, --timeout=INTEGER

  Seconds before connection times out (default: 10)

  -v, --verbose

  Show details for command-line debugging (Nagios may truncate output)
- 1.
- 2.
- 3.
- 4.
- 5.
- 6.
- 7.
- 8.
- 9.
- 10.
- 11.
- 12.
- 13.
- 14.
- 15.
- 16.
- 17.
- 18.
- 19.
- 20.
- 21.
- 22.
- 23.
- 24.
- 25.
- 26.
- 27.
- 28.
- 29.
- 30.
- 31.
- 32.
- 33.
- 34.
- 35.
- 36.
- 37.
- 38.
- 39.
- 40.
- 41.
- 42.
- 43.
- 44.
- 45.
- 46.
- 47.
- 48.
- 49.
- 50.
- 51.
- 52.
- 53.
- 54.
- 55.
- 56.
- 57.
- 58.
- 59.
- 60.
- 61.
- 62.
- 63.
- 64.
- 65.
- 66.
- 67.
- 68.
- 69.
- 70.
- 71.
- 72.
- 73.
- 74.
- 75.
- 76.
- 77.
- 78.
- 79.
- 80.
- 81.
- 82.
- 83.
- 84.
- 85.
- 86.
- 87.
- 88.
- 89.
- 90.
- 91.
- 92.
- 93.
- 94.
- 95.
- 96.
- 97.
- 98.
- 99.
- 100.
- 101.
- 102.
- 103.
- 104.
- 105.
- 106.
- 107.
- 108.
- 109.
- 110.
- 111.
- 112.
- 113.
- 114.
- 115.
- 116.
- 117.
- 118.
- 119.
- 120.
- 121.
- 122.
- 123.
- 124.
- 125.
- 126.
- 127.
- 128.
- 129.
- 130.
- 131.
- 132.
- 133.
- 134.
- 135.
- 136.
- 137.
- 138.
- 139.
- 140.
- 141.
- 142.
- 143.
- 144.
- 145.
- 146.
- 147.
- 148.
通过check_http的帮助我们可以清楚的了解到该命令可以为我们做什么,以及如何去做。选项虽然很多,其实常被用到的却只有几项,而且很多选项是有默认值的一般无需设置。下面就我们需要用到的几个选项做一个简要的说明。
选项说明:
-H, --hostname=ADDRESS主机名或域名
-I, --IP-address=ADDRESSserver的IP地址,用于在不能DNS的情况下
-p, --port=INTEGER端口号,默认80
-u, --url=PATHurl,默认是/
-w, --warning=DOUBLEwarning状态的响应时间,单位是秒
-c, --critical=DOUBLEcritical状态的响应时间,单位是秒
-t, --timeout=INTEGER连接超时时间,默认10秒
举一个简单的实例,一个网站的域名是www.testhost.test,端口是默认80,需要监测它的主页/index.html,warning时间和critical时间、 timeout时间使用默认值,不设置。具体命令书写如下。
  $ ./check_http -H www.testhost.test -u /index.html

  HTTP OK HTTP/1.1 200 OK - 115357 bytes in 1.717 seconds |time=1.716934s;;;0.000000 size=115357B;;;0
- 1.
- 2.
- 3.
- 4.
可以看出该网页是正常的,如果网页地址不对或显示有错误也会有相应的反馈信息。
3. 具体配置Nagios来监控网页
通过Nagios监控网页一般有两种方式,一种是直接通过Nagios监控主机配置监控服务监视网页;另一种是在某一安装了NRPE的客户端主机上配置监控命令,通过NRPE监控网页情况,再将结果传回给Nagios监控主机。通过一个装有NRPE的客户端作为桥梁的方式可以使主机更加安全,减轻Nagios主机的负担,同时可以避免在Nagios主机上配置DNS等不必要的麻烦。 方式一、直接通过Nagios主机监控网页。
Linux下监控网页-Nagios就介绍到这里了,下一节:Linux下监控网页-NRPE
【编辑推荐】