一、算法介绍
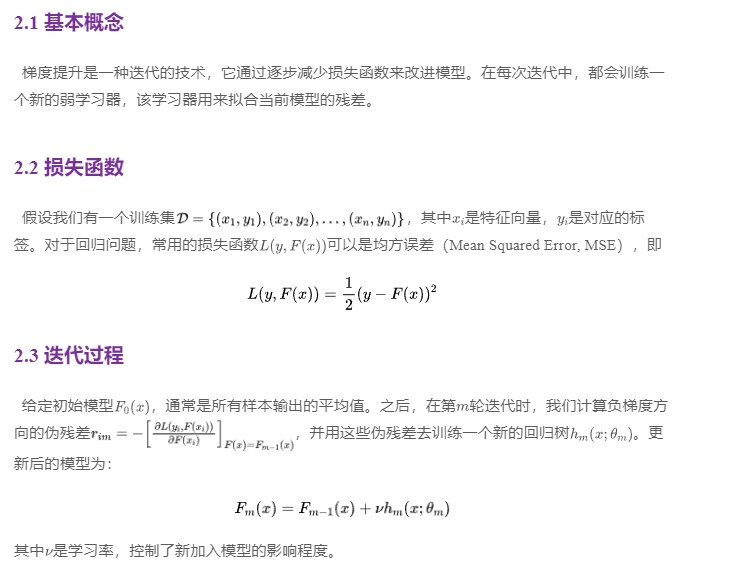
梯度提升树(Gradient Boosting Trees, GBT)是一种强大的集成学习方法,它通过迭代地添加弱预测模型来构建一个强预测模型。在每一轮迭代中,新的模型会试图纠正前序模型产生的错误。GBT可以用于回归和分类问题,并且在许多实际应用中表现优异。
二、算法原理

三、 案例分析
为了展示梯度提升树的实际应用,我们将使用提供的数据集来预测机器是否会发生故障。首先加载数据,并进行必要的预处理。
3.1 数据预处理与模型建立
import pandas as pd
from sklearn.ensemble import GradientBoostingClassifier
from sklearn.model_selection import train_test_split
from sklearn.metrics import classification_report, confusion_matrix, accuracy_score, roc_auc_score, roc_curve
import seaborn as sns
import matplotlib.pyplot as plt

# 加载数据
data = pd.read_excel('data.xlsx', sheet_name='Sheet1')

# 数据清洗
data.drop_duplicates(inplace=True)
X = data.drop(columns=['机器编号', '是否发生故障', '具体故障类别'])
y = data['是否发生故障']

# 划分训练集和测试集
X_train, X_test, y_train, y_test = train_test_split(X, y, test_size=0.2, random_state=42)

# 创建并训练模型
gbt_model = GradientBoostingClassifier(n_estimators=100, learning_rate=0.1, max_depth=3, random_state=42)
gbt_model.fit(X_train, y_train)

# 预测
y_pred = gbt_model.predict(X_test)
y_pred_proba = gbt_model.predict_proba(X_test)[:, 1]  # 获取正类的概率

# 评估模型
accuracy = accuracy_score(y_test, y_pred)
print(f'Accuracy: {accuracy:.2f}')

# 打印分类报告
print(classification_report(y_test, y_pred))

# 绘制混淆矩阵
cm = confusion_matrix(y_test, y_pred)
plt.figure(figsize=(8, 6))
sns.heatmap(cm, annot=True, fmt="d", cmap="Blues", cbar=False,
            xticklabels=['No Failure', 'Failure'],
            yticklabels=['No Failure', 'Failure'])
plt.xlabel('Predicted')
plt.ylabel('Actual')
plt.title('Confusion Matrix')
plt.show()

# 计算ROC曲线
fpr, tpr, _ = roc_curve(y_test, y_pred_proba)
roc_auc = roc_auc_score(y_test, y_pred_proba)

# 绘制ROC曲线
plt.figure(figsize=(8, 6))
plt.plot(fpr, tpr, color='darkorange', lw=2, label=f'ROC curve (area = {roc_auc:.2f})')
plt.plot([0, 1], [0, 1], color='navy', lw=2, linestyle='--')
plt.xlim([0.0, 1.0])
plt.ylim([0.0, 1.05])
plt.xlabel('False Positive Rate')
plt.ylabel('True Positive Rate')
plt.title('Receiver Operating Characteristic (ROC)')
plt.legend(loc="lower right")
plt.show()
- 1.
- 2.
- 3.
- 4.
- 5.
- 6.
- 7.
- 8.
- 9.
- 10.
- 11.
- 12.
- 13.
- 14.
- 15.
- 16.
- 17.
- 18.
- 19.
- 20.
- 21.
- 22.
- 23.
- 24.
- 25.
- 26.
- 27.
- 28.
- 29.
- 30.
- 31.
- 32.
- 33.
- 34.
- 35.
- 36.
- 37.
- 38.
- 39.
- 40.
- 41.
- 42.
- 43.
- 44.
- 45.
- 46.
- 47.
- 48.
- 49.
- 50.
- 51.
- 52.
- 53.
- 54.
- 55.
- 56.
- 57.
- 58.
- 59.
3.2 结果分析
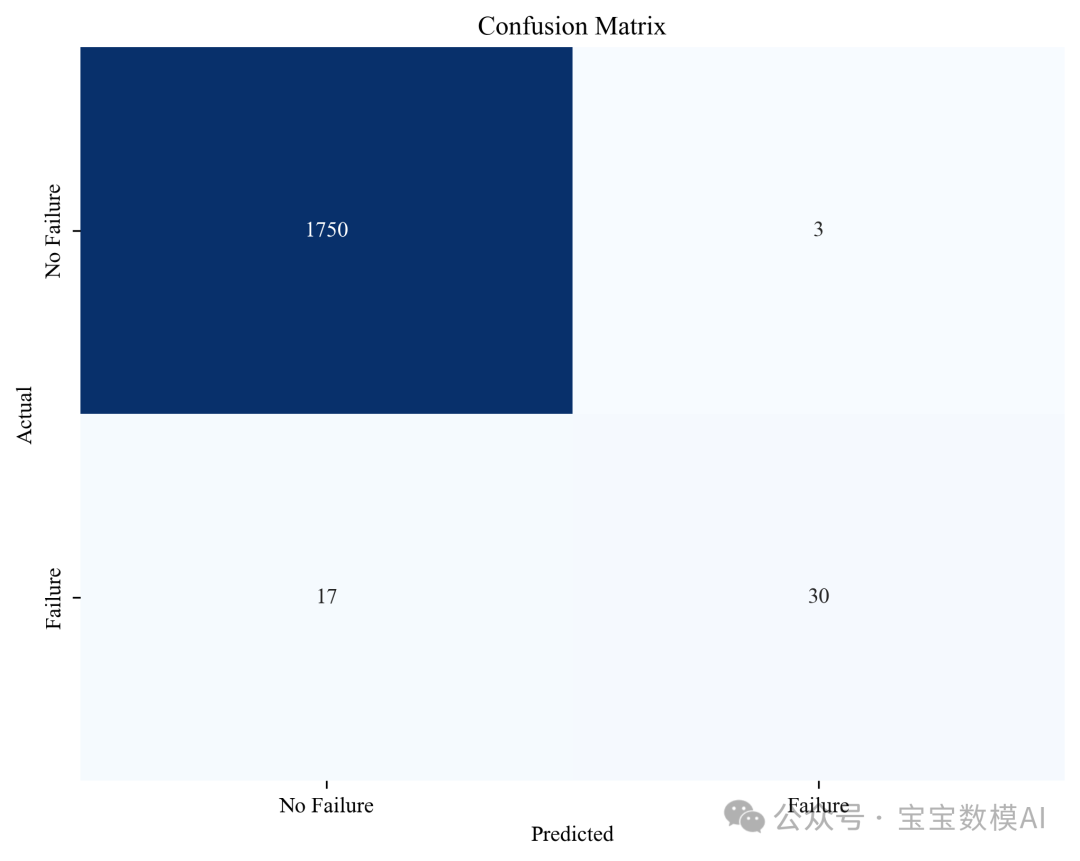
通过上述代码,我们得到了模型在测试集上的准确率,并打印了详细的分类报告,其中包括精确度(Precision)、召回率(Recall)以及F1分数(F1-score)。
此外,我们还绘制了混淆矩阵图,以便更直观地了解模型的表现情况。

- 准确率 (Accuracy):表示模型正确预测的比例。
- 精确度 (Precision):表示被模型预测为正类的样本中实际为正类的比例。
- 召回率 (Recall):表示所有实际为正类的样本中,被模型正确识别出来的比例。
- F1分数 (F1-score):是精确度和召回率的调和平均数,用于综合评价模型的性能。
除了这些指标外,我们还绘制了ROC曲线,这可以帮助我们理解模型区分正负样本的能力。

ROC曲线下的面积(AUC)是一个重要的性能指标,它反映了模型的整体表现。一个理想的模型应该具有接近1.0的AUC值,这意味着模型能够很好地将正负样本区分开来。
四、结语
梯度提升树是一种非常有效的方法,尤其适用于处理复杂的数据模式。通过本文的介绍与案例分析,希望能帮助读者更好地理解这一算法,并能够在实践中加以运用。在未来的工作中,尝试不同的参数设置以及结合其他技术可能会带来更好的结果。
本文转载自 宝宝数模AI,作者: BBSM


