一种基于学习的电池寿命预测(Python)
import numpy as np
import matplotlib.pyplot as plt
import matplotlib.cm as cm
import pandas as pd
import glob
import time
from qore_sdk.client import WebQoreClient
from tqdm import tqdm_notebook as tqdm
from ipywidgets import IntProgress
df_35 = pd.read_csv('CS2_35.csv',index_col=0).dropna()
df_36 = pd.read_csv('CS2_36.csv',index_col=0).dropna()
df_37 = pd.read_csv('CS2_37.csv',index_col=0).dropna()
df_38 = pd.read_csv('CS2_38.csv',index_col=0).dropna()
Plot Parameters
Only discharge capacity is used for prediction
fig = plt.figure(figsize=(9,8),dpi=150)
names = ['capacity','resistance','CCCT','CVCT']
titles = ['Discharge Capacity (mAh)', 'Internal Resistance (Ohm)',
          'Constant Current Charging Time (s)','Constant Voltage Charging Time (s)']
plt.subplots_adjust(hspace=0.25)
for i in range(4):
    plt.subplot(2,2,i+1)
    plt.plot(df_35[names[i]],'o',ms=2,label='#35')
    plt.plot(df_36[names[i]],'o',ms=2,label='#36')
    plt.plot(df_37[names[i]],'o',ms=2,label='#37')
    plt.plot(df_38[names[i]],'o',ms=2,label='#38')
    plt.title(titles[i],fontsize=14)
    plt.legend(loc='upper right')
    if(i == 3):
        plt.ylim(1000,5000)
    plt.xlim(-20,1100)
X_train,y_train = ConvertData([df_35,df_37,df_38],50)
X_test,y_test = ConvertData([df_36],50)
print(X_train.shape,X_test.shape,y_train.shape,y_test.shape)
(2588, 50) (873, 50) (2588,) (873,)
idx = np.arange(0,X_train.shape[0],1)
idx = np.random.permutation(idx)
idx_lim = idx[:500]


X_train = X_train[idx_lim]
y_train = y_train[idx_lim]
X_train = X_train.reshape([X_train.shape[0], X_train.shape[1], 1])
X_test = X_test.reshape([X_test.shape[0], X_test.shape[1], 1])
print(X_train.shape,X_test.shape,y_train.shape,y_test.shape)
(500, 50, 1) (873, 50, 1) (500,) (873,)
%%time
client = WebQoreClient(username, password, endpoint=endpoint)
time_ = client.regression_train(X_train, y_train)
print('Time:', time_['train_time'], 's')
Time: 1.8583974838256836 s
Wall time: 2.7 s
res = client.regression_predict(X_train)


fig=plt.figure(figsize=(12, 4),dpi=150)
plt.plot(res['Y'],alpha=0.7,label='Prediction')
plt.plot(y_train,alpha=0.7,label='True')
plt.legend(loc='upper right',fnotallow=12)
res = client.regression_predict(X_test[300:800])
x_range = np.linspace(301,800,500)
fig=plt.figure(figsize=(12, 4),dpi=150)
plt.plot(x_range,y_test[300:800],label='true',c='gray')
plt.plot(x_range,res['Y'],label='Qore',c='red',alpha=0.8)
plt.xlabel('Number of Cycle',fnotallow=13)
plt.ylabel('DIscharge Capacity (Ah)',fnotallow=13)
plt.title('Prediction of Discharge Capacity of Test Data (CS2-36)',fnotallow=14)
plt.legend(loc='upper right',fnotallow=12)
from sklearn.metrics import mean_squared_error
mean_squared_error(y_test[300:800], res['Y'])
initial = X_test[500]
results = []
for i in tqdm(range(50)):
    if(i == 0):
        res = client.regression_predict([initial])['Y']
        results.append(res[0])
        time.sleep(1)
    else:
        initial = np.vstack((initial[1:],np.array(res)))
        res = client.regression_predict([initial])['Y']
        results.append(res[0])
        time.sleep(1)
HBox(children=(IntProgress(value=0, max=50), HTML(value='')))
fig=plt.figure(figsize=(12,4),dpi=150)
plt.plot(np.linspace(501,550,50),results,'o-',ms=4,lw=1,label='predict')
plt.plot(np.linspace(401,550,150),y_test[400:550],'o-',lw=1,ms=4,label='true')
plt.legend(loc='upper right',fnotallow=12)
plt.xlabel('Number of Cycle',fnotallow=13)
plt.ylabel('Discharge Capacity (Ah)',fnotallow=13)
知乎学术咨询:
https://www.zhihu.com/consult/people/792359672131756032?isMe=1担任《Mechanical System and Signal Processing》《中国电机工程学报》等期刊审稿专家,擅长领域:信号滤波/降噪,机器学习/深度学习,时间序列预分析/预测,设备故障诊断/缺陷检测/异常检测。
分割线分割线分割线
涡扇发动机全称为涡轮风扇发动机,是一种先进的空中引擎,由涡轮喷气发动机发展而来。涡扇发动机主要特点是首级压缩机的面积比涡轮喷气发动机大。同时,空气螺旋桨(扇)将部分吸入的空气从喷射引擎喷射出来,并将其向后推动,以达到推进的目的。
涡扇发动机结构是一种特殊的引擎结构,它在涡轮喷气发动机的基础上再增加了 1-2 级低压(低速)涡轮,这些涡轮可以驱动一定数量的风扇,消耗掉一部分涡喷发动机(核心机)的燃气排气动能,从而进一步降低燃气排出速度,提高引擎的性能。从前至后,涡扇发动机由风扇,压气机,燃烧室,导向叶片,高压低压涡轮,加力燃烧室和尾喷管组成。
目前大多数论文的实验中使用的数据集是美国国家航空航天局的 C-MAPSS 数据集。C-MAPSS 数据集是由模拟航空发动机的模拟软件生成。模拟发动机的结构图如下:
主要部件有低压涡轮(low pressure turbine,LPT)、高压涡轮(high pressure turbine,HPT)、高压压气机(high pressure compressor,HPC)、低压压气机(low pressure compressor,LPC)、风扇(fan)、喷嘴(nozzle)、燃烧室(combustor)、低压转子转速(N1)和高压转子转速(N2)等。风扇在正常飞行条件下工作,将空气分流至内、外涵道。LPC 和 HPC 通过增温增压技术将高温、压力混合气体输送到 combustor。LPT 可以有效减少空气的流速,大大提高飞机煤油的化学能转换效率。而 HPT 则是利用高温、高压气体对涡轮叶片施加做功,从而产生机械能。N1、N2 和 nozzle 的应用大大提升了发动机的燃烧效率。
监控涡扇发动机状况为21个传感器。由于传感器的单位不同,传感器记录的数值的量级也有所差异,位于10的-2次方到10的3次方之间。例如,燃烧室油气比数值的量级是10的-2次方;低压涡轮冷气流量数值的量级是10的1次方。表2-2描述了NASA的C-MAPSS数据集。由于不同的操作条件和故障模式,数据集可以分为四个子数据集,依次是FD001、FD002、FD003和FD004。每个子数据分为训练集和测试集,记录了发动机的3种操作设置和21个传感器数据。每个子数据集通过.txt文件单独保存。在.txt文件中,每一行记录了一个引擎某个时间刻的3种操作设置和21个传感器数据。关于故障模式和操作条件方面,FD001和FD002子数据集包含一种故障模式(高压压气机退化),FD003和FD004包含两种故障模式(高压压气机退化和风扇退化);FD001和FD003只有一种操作条件,FD002和FD004有六种操作条件。由于FD002和FD004子数据集引擎的操作环境复杂多变,FD002和FD004子数据集中RUL的预测更加困难。
可见,涡扇发动机数据集包含大量的按时间顺序采集的传感器数据,这些数据包括发动机温度、压力、振动等多个方面的指标。并且涡扇发动机可能会出现多种故障模式。这适合用时间序列模型去对涡扇发动机的剩余使用寿命做预测。
鉴于此,采用机器学习和深度学习对C-MAPSS涡扇发动机进行剩余使用寿命RUL预测,Python代码,Jupyter Notebook环境,方法如下:
(1)VAR with LSTM
(2)VAR with Logistic Regression
(3)LSTM (Lookback=20,10,5,1)
LSTM Lookback=10的结果如下:
final_pred = []
count = 0
for i in range(100):
    j = max_cycles[i]
    temp = pred[count+j-1]
    count=count+j
    final_pred.append(int(temp))


print(final_pred)


fig = plt.figure(figsize=(18,10))
plt.plot(final_pred,color='red', label='prediction')
plt.plot(y_test,color='blue', label='y_test')
plt.legend(loc='upper left')
plt.grid()
plt.show()


print("mean_squared_error >> ", mean_squared_error(y_test,final_pred))
print("root_mean_squared_error >> ", math.sqrt(mean_squared_error(y_test,final_pred)))
print("mean_absolute_error >>",mean_absolute_error(y_test,final_pred))
VAR with Logistic Regression结果:
fig = plt.figure(figsize=(18,10))
plt.plot(logistic_pred,color='red', label='prediction')
plt.plot(y_test,color='blue', label='y_test')
plt.legend(loc='upper left')
plt.grid()
plt.show()
VAR with LSTM结果:
fig = plt.figure(figsize=(18,10))
plt.plot(lstm_pred,color='red', label='prediction')
plt.plot(y_test,color='blue', label='y_test')
plt.legend(loc='upper left')
plt.grid()
plt.show()
完整代码可通过知乎学术咨询获得:
https://www.zhihu.com/consult/people/792359672131756032?isMe=1
基于机器学习和深度学习的NASA涡扇发动机剩余使用寿命预测(C-MAPSS数据集,Python代码,ipynb 文件)
以美国航空航天局提供的航空涡扇发动机退化数据集为研究对象,该数据集包含多台发动机从启动到失效期间多个运行周期的多源传感器时序状态监测数据,它们共同表征了发动机的性能退化情况。为减小计算成本,需要对原始多源传感器监测数据进行数据筛选,剔除与发动机性能退化情况无关的传感器数据项,保留有用数据,为对多源传感器数据进行有效甄别,考虑综合多种数据筛选方式,以保证筛选结果的准确性。
主要内容如下:
Data Visualization:
- Maximum life chart and engine life distribution chart for each unit.
- Correlation coefficient chart between sensors and RUL.
- Line chart showing the relationship between sensors and RUL for each engine.
- Value distribution chart for each sensor.
Feature Engineering:
- Based on the line chart showing the relationship between sensors and engine RUL, sensors 1, 5, 10, 16, 18, and 19 are found to be constant. Hence, these features are removed. Finally, the data is normalized.
Machine Learning Model:
- "Rolling mean feature" is added to the data, representing the average value of features over 10 time periods.
- Seven models are built: Linear regression, Light GBM, Random Forest, KNN, XGBoost, SVR, and Extra Tree.
- MAE, RMSE, and R2 are used as evaluation metrics. SVR performs the best with an R2 of 0.61 and RMSE = 25.7.
Deep Learning Model:
- The time window length is set to 30, and the shift length is set to 1. The training and test data are processed to be in a three-dimensional format for input to the models.
- Six deep learning models are built: CNN, LSTM, Stacked LSTM, Bi-LSTM, GRU, and a hybrid model combining CNN and LSTM.
- Convergence charts and evaluation of test data predictions are plotted. Each model has an R2 higher than 0.85, with Bi-LSTM achieving an R2 of 0.89 and RMSE of 13.5.
机器学习模型所用模块:
import pandas as pd
import numpy as np
import matplotlib.pyplot as plt
import seaborn as sns
import random
import warnings
warnings.filterwarnings('ignore')


from sklearn.metrics import mean_squared_error, r2_score,mean_absolute_error
from sklearn.model_selection import train_test_split
from sklearn.preprocessing import StandardScaler,MinMaxScaler


from sklearn.linear_model import LinearRegression
from sklearn.svm import SVR
from sklearn.ensemble import RandomForestRegressor,ExtraTreesRegressor
from sklearn.neighbors import KNeighborsRegressor
from xgboost import XGBRegressor
from lightgbm import LGBMRegressor
结果如下:
深度学习所用模块:
import pandas as pd
import numpy as np
import matplotlib.pyplot as plt
import seaborn as sns
import random
import time
import warnings
warnings.filterwarnings('ignore')


from sklearn.metrics import mean_squared_error, r2_score, mean_absolute_error
from sklearn.model_selection import train_test_split
from sklearn.preprocessing import StandardScaler,MinMaxScaler
#from google.colab import drive
#drive.mount('/content/drive')


# model
import tensorflow as tf
from tensorflow import keras
from tensorflow.keras import layers
from tensorflow.keras.models import Sequential
from tensorflow.keras.layers import Dense, LSTM, Conv1D
from tensorflow.keras.layers import BatchNormalization, Dropout
from tensorflow.keras.layers import TimeDistributed, Flatten
from tensorflow.keras.layers.experimental import preprocessing
from tensorflow.keras.optimizers import Adam
from tensorflow.keras.callbacks import ReduceLROnPlateau,EarlyStopping
完整代码可通过知乎学术咨询获得:
https://www.zhihu.com/consult/people/792359672131756032?isMe=1Python环境下基于机器学习的NASA涡轮风扇发动机剩余使用寿命RUL预测
本例所用的数据集为C-MAPSS数据集,C-MAPSS数据集是美国NASA发布的涡轮风扇发动机数据集,其中包含不同工作条件和故障模式下涡轮风扇发动机多源性能的退化数据,共有 4 个子数据集,每个子集又可分为训练集、 测试集和RUL标签。其中,训练集包含航空发动机从开始运行到发生故障的所有状态参数;测试集包含一定数量发动机从开始运行到发生故障前某一时间点的全部状态参数;RUL标签记录测试集中发动机的 RUL 值,可用于评估模 型的RUL预测能力。C-MAPSS数据集包含的基本信息如下:
本例只采用FD001子数据集:
关于python的集成环境,我一般Anaconda 和 winpython 都用,windows下主要用Winpython,IDE为spyder(类MATLAB界面)。
正如peng wang老师所说
winpython, anaconda 哪个更好?- peng wang的回答 - 知乎 https://www.zhihu.com/question/27615938/answer/71207511
winpython脱胎于pythonxy,面向科学计算,兼顾数据分析与挖掘;Anaconda主要面向数据分析与挖掘方面,在大数据处理方面有自己特色的一些包;winpython强调便携性,被做成绿色软件,不写入注册表,安装其实就是解压到某个文件夹,移动文件夹甚至放到U盘里在其他电脑上也能用;Anaconda则算是传统的软件模式。winpython是由个人维护;Anaconda由数据分析服务公司维护,意味着Winpython在很多方面都从简,而Anaconda会提供一些人性化设置。Winpython 只能在windows上用,Anaconda则有linux的版本。
抛开软件包的差异,我个人也推荐初学者用winpython,正因为其简单,问题也少点,由于便携性的特点系统坏了,重装后也能直接用。
请直接安装、使用winPython:WinPython download因为很多模块以及集成的模块
可以选择版本,不一定要用最新版本,否则可能出现不兼容问题。
下载、解压后如下
打开spyder就可以用了。
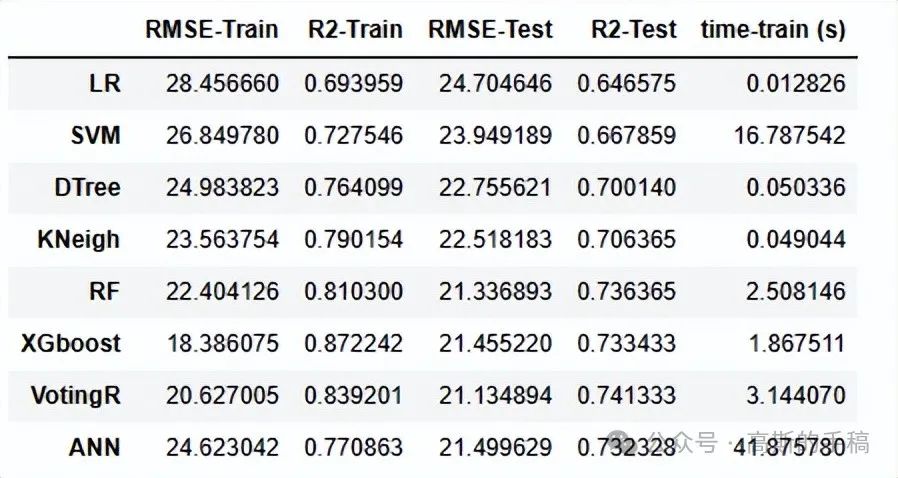
采用8种机器学习方法对NASA涡轮风扇发动机进行剩余使用寿命RUL预测,8种方法分别为:Linear Regression,SVM regression,Decision Tree regression,KNN model,Random Forest,Gradient Boosting Regressor,Voting Regressor,ANN Model。
首先导入相关模块
import pandas as pd
import seaborn as sns
import numpy as np
import matplotlib.pyplot as plt
from sklearn.preprocessing import StandardScaler
from sklearn.model_selection import train_test_split
from sklearn.linear_model import LinearRegression
from sklearn.svm import SVR
from sklearn.tree import DecisionTreeRegressor
from sklearn.ensemble import RandomForestRegressor
from sklearn.metrics import mean_squared_error, r2_score
import tensorflow as tf
from tensorflow.keras.layers import Dense
版本如下:
tensorflow=2.8.0
keras=2.8.0
sklearn=1.0.2
导入数据
path = ''


# define column names
col_names=["unit_nb","time_cycle"]+["set_1","set_2","set_3"] + [f's_{i}' for i in range(1,22)]


# read data
df_train = train_data = pd.read_csv(path+"train_FD001.txt", index_col=False,
                                    sep= "\s+", header = None,nam
es=col_names )
df_test和y_test同理导入,看一下训练样本
df_train.head()进行探索性数据分析
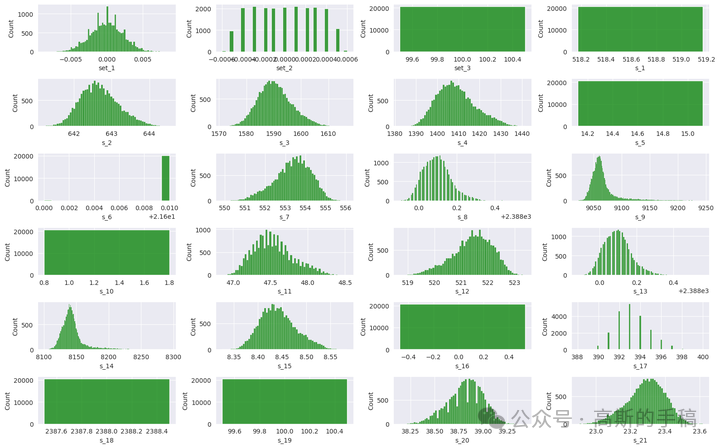
df_train[col_names[1:]].describe().T数据可视化分析:
sns.set_style("darkgrid")
plt.figure(figsize=(16,10))
k = 1
for col in col_names[2:] :
    plt.subplot(6,4,k)
    sns.histplot(df_train[col],color='Green')
    k+=1
plt.tight_layout()
plt.show()
def remaining_useful_life(df):
    # Get the total number of cycles for each unit
    grouped_by_unit = df.groupby(by="unit_nb")
    max_cycle = grouped_by_unit["time_cycle"].max()

    # Merge the max cycle back into the original frame
    result_frame = df.merge(max_cycle.to_frame(name='max_cycle'), left_notallow='unit_nb', right_index=True)

    # Calculate remaining useful life for each row
    remaining_useful_life = result_frame["max_cycle"] - result_frame["time_cycle"]
    result_frame["RUL"] = remaining_useful_life

    # drop max_cycle as it's no longer needed
    result_frame = result_frame.drop("max_cycle", axis=1)
    return result_frame
df_train = remaining_useful_life(df_train)
df_train.head()
绘制最大RUL的直方图分布
plt.figure(figsize=(10,5))
sns.histplot(max_ruls.RUL, color='r')
plt.xlabel('RUL')
plt.ylabel('Frequency')
plt.axvline(x=max_ruls.RUL.mean(), ls='--',color='k',label=f'mean={max_ruls.RUL.mean()}')
plt.axvline(x=max_ruls.RUL.median(),color='b',label=f'median={max_ruls.RUL.median()}')
plt.legend()
plt.show()
plt.figure(figsize=(20, 8))cor_matrix = df_train.corr()
heatmap = sns.heatmap(cor_matrix, vmin=-1, vmax=1, annot=True)
heatmap.set_title('Correlation Heatmap', fnotallow={'fontsize':12}, pad=10);
添加图片注释,不超过 140 字(可选)
col = df_train.describe().columns
#we drop colummns with standard deviation is less than 0.0001
sensors_to_drop = list(col[df_train.describe().loc['std']<0.001]) + ['s_14']
print(sensors_to_drop)
#
df_train.drop(sensors_to_drop,axis=1,inplace=True)
df_test.drop(sensors_to_drop,axis=1,inplace=True)


sns.set_style("darkgrid")
fig, axs = plt.subplots(4,4, figsize=(25, 18), facecolor='w', edgecolor='k')
fig.subplots_adjust(hspace = .22, wspace=.2)
i=0
axs = axs.ravel()
index = list(df_train.unit_nb.unique())
for sensor in df_train.columns[1:-1]:
    for idx in index[1:-1:15]:
        axs[i].plot('RUL', sensor,data=df_train[df_train.unit_nb==idx])

    axs[i].set_xlim(350,0)
    axs[i].set(xticks=np.arange(0, 350, 25))
    axs[i].set_ylabel(sensor)
    axs[i].set_xlabel('Remaining Use Life')
    i=i+1
X_train = df_train[df_train.columns[3:-1]]
y_train = df_train.RUL
X_test = df_test.groupby('unit_nb').last().reset_index()[df_train.columns[3:-1]]


y_train = y_train.clip(upper=155)


# create evalute function for train and test data
def evaluate(y_true, y_hat):
    RMSE = np.sqrt(mean_squared_error(y_true, y_hat))
    R2_score = r2_score(y_true, y_hat)
    return [RMSE,R2_score];


#Make Dataframe which will contain results
Results = pd.DataFrame(columns=['RMSE-Train','R2-Train','RMSE-Test','R
2-Test','time-train (s)'])训练线性回归模型
import time
Sc = StandardScaler()
X_train1 = Sc.fit_transform(X_train)
X_test1 = Sc.transform(X_test)
# create and fit model
start = time.time()
lm = LinearRegression()
lm.fit(X_train1, y_train)
end_fit = time.time()- start
# predict and evaluate
y_pred_train = lm.predict(X_train1)
y_pred_test = lm.predict(X_test1)
Results.loc['LR']=evaluate(y_train, y_pred_train)+evaluate(y_test, y_pred_test)+[end_fit]
Results


def plot_prediction(y_test,y_pred_test,score):
    plt.style.use("ggplot")
    fig, ax = plt.subplots(1, 2, figsize=(17, 4), gridspec_kw={'width_ratios': [1.2, 3]})
    fig.subplots_adjust(wspace=.12)
    ax[0].plot([min(y_test),max(y_test)],
         [min(y_test),max(y_test)],lw=3,c='r')
    ax[0].scatter(y_test,y_pred_test,lw=3,c='g')
    ax[0].annotate(text=('RMSE: ' + "{:.2f}".format(score[0]) +'\n' +
                  'R2: ' + "{:.2%}".format(score[1])), xy=(0,140), size='large');
    ax[0].set_title('Actual vs predicted RUL')
    ax[0].set_xlabel('Actual')
    ax[0].set_ylabel('Predicted');

    ax[1].plot(range(0,100),y_test,lw=2,c='r',label = 'actual')
    ax[1].plot(range(0,100),y_pred_test,lw=1,ls='--', c='b',label = 'prediction')
    ax[1].legend()


    ax[1].set_title('Actual vs predicted RUL')
    ax[1].set_xlabel('Engine num')
    ax[1].set_ylabel('RUL');


plot_prediction(y_test.RUL,y_pred_test,evaluate(y_test, y_pred_test))
训练支持向量机模型
# create and fit model
start = time.time()
svr = SVR(kernel="rbf", gamma=0.25, epsilnotallow=0.05)
svr.fit(X_train1, y_train)
end_fit = time.time()-start
# predict and evaluate
y_pred_train = svr.predict(X_train1)
y_pred_test = svr.predict(X_test1)
Results.loc['SVM']=evaluate(y_train, y_pred_train)+evaluate(y_test, y_pred_test)+[end_fit]
Results


plot_prediction(y_test.RUL,y_pred_test,evaluate(y_test, y_pred_test))
训练决策树模型
start=time.time()
dtr = DecisionTreeRegressor(random_state=42, max_features='sqrt', max_depth=10, min_samples_split=10)
dtr.fit(X_train1, y_train)
end_fit =time.time()-start
# predict and evaluate
y_pred_train = dtr.predict(X_train1)
y_pred_test = dtr.predict(X_test1)
Results.loc['DTree']=evaluate(y_train, y_pred_train)+evaluate(y_test, y_pred_test)+[end_fit]
Results


plot_prediction(y_test.RUL,y_pred_test,evaluate(y_test, y_pred_test
))
训练KNN模型
from sklearn.neighbors import KNeighborsRegressor
# Evaluating on Train Data Set
start = time.time()
Kneigh = KNeighborsRegressor(n_neighbors=7)
Kneigh.fit(X_train1, y_train)
end_fit =time.time()-start
# predict and evaluate
y_pred_train = Kneigh.predict(X_train1)
y_pred_test = Kneigh.predict(X_test1)
Results.loc['KNeigh']=evaluate(y_train, y_pred_train)+evaluate(y_test, y_pred_test)+[end_fit]
Results


plot_prediction(y_test.RUL,y_pred_test,evaluate(y_test, y_pred_test))
训练随机森林模型
start = time.time()
rf = RandomForestRegressor(n_jobs=-1, n_estimators=130,max_features='sqrt', min_samples_split= 2, max_depth=10, random_state=42)
rf.fit(X_train1, y_train)
y_hat_train1 = rf.predict(X_train1)
end_fit = time.time()-start
# predict and evaluate
y_pred_train = rf.predict(X_train1)
y_pred_test = rf.predict(X_test1)
Results.loc['RF']=evaluate(y_train, y_pred_train)+evaluate(y_test, y_pred_test)+[end_fit]
Results
plot_prediction(y_test.RUL,y_pred_test,evaluate(y_test, y_pred_test))
训练Gradient Boosting Regressor模型
from sklearn.ensemble import GradientBoostingRegressor
# Evaluating on Train Data Set
start = time.time()
xgb_r = GradientBoostingRegressor(n_estimators=45, max_depth=10, min_samples_leaf=7, max_features='sqrt', random_state=42,learning_rate=0.11)
xgb_r.fit(X_train1, y_train)
end_fit =time.time()-start
# predict and evaluate
y_pred_train = xgb_r.predict(X_train1)
y_pred_test = xgb_r.predict(X_test1)
Results.loc['XGboost']=evaluate(y_train, y_pred_train)+evaluate(y_test, y_pred_test)+[end_fit]
Results


plot_prediction(y_test.RUL,y_pred_test,evaluate(y_test, y_pred_test))
训练Voting Regressor模型
from sklearn.ensemble import VotingRegressor
start=time.time()
Vot_R = VotingRegressor([("rf", rf), ("xgb", xgb_r)],weights=[1.5,1],n_jobs=-1)
Vot_R.fit(X_train1, y_train)
end_fit =time.time()-start
# predict and evaluate
y_pred_train = Vot_R.predict(X_train1)
y_pred_test = Vot_R.predict(X_test1)
Results.loc['VotingR']=evaluate(y_train, y_pred_train)+evaluate(y_test, y_pred_test)+[end_fit]
Results


plot_prediction(y_test.RUL,y_pred_test,evaluate(y_test, y_pred_test))
训练ANN模型
star=time.time()
model = tf.keras.models.Sequential()
model.add(Dense(32, activatinotallow='relu'))
model.add(Dense(64, activatinotallow='relu'))
model.add(Dense(128, activatinotallow='relu'))
model.add(Dense(128, activatinotallow='relu'))
model.add(Dense(1, activatinotallow='linear'))
model.compile(loss= 'msle', optimizer='adam', metrics=['msle'])
history = model.fit(x=X_train1,y=y_train, epochs = 40, batch_size = 64)
end_fit = time.time()-star


# predict and evaluate
y_pred_train = model.predict(X_train1)
y_pred_test = model.predict(X_test1)
Results.loc['ANN']=evaluate(y_train, y_pred_train)+evaluate(y_test, y_pred_test)+[end_fit]
Results
本文转载自高斯的手稿


