一个很强大的集成学习算法:XGBoost!
一、算法介绍
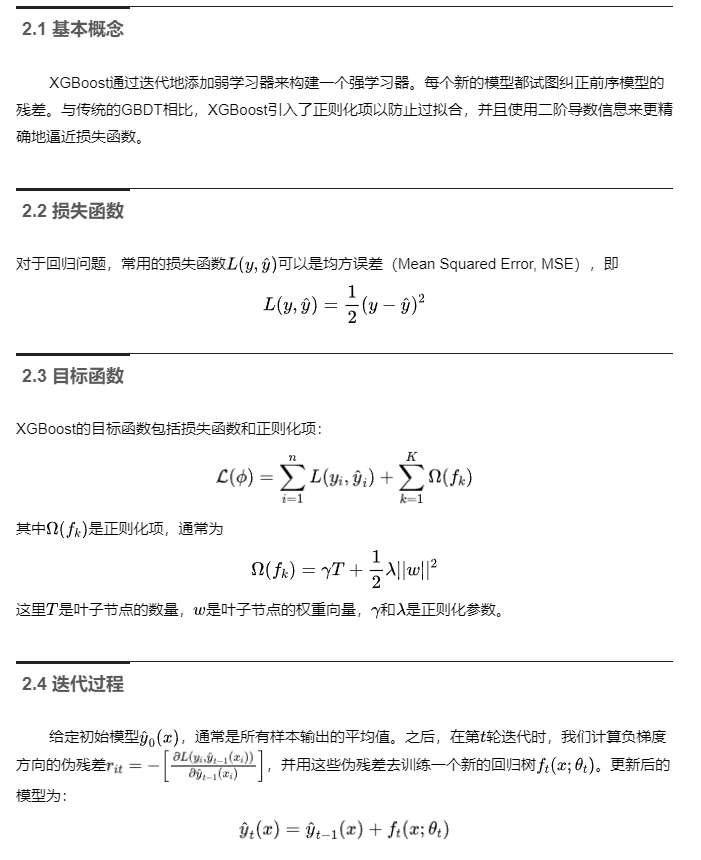
XGBoost(eXtreme Gradient Boosting)是一种高效的梯度提升框架,它实现了梯度提升决策树(Gradient Boosting Decision Trees, GBDT),并在此基础上进行了优化。XGBoost在许多机器学习竞赛中表现出色,因其高效性和强大的预测能力而受到广泛欢迎。XGBoost支持多种目标函数和评估指标,可以处理回归、分类以及排名等问题。
二、算法原理

三、案例分析
3.1 数据集介绍
本次案例分析使用的数据集包含了一系列工业机器的运行状态记录,包括机器编号、质量等级、工厂温度、机器温度、转速、扭矩、使用时长等特征,以及是否发生故障的标签。我们的任务是基于这些特征预测机器是否会故障。
3.2 数据预处理与模型建立
为了展示XGBoost的实际应用,我们将使用提供的数据集来预测机器是否会发生故障。首先加载数据,并进行必要的预处理。
import pandas as pd
from xgboost import XGBClassifier
from sklearn.model_selection import train_test_split
from sklearn.metrics import classification_report, confusion_matrix, roc_auc_score, roc_curve, precision_recall_curve, auc
import seaborn as sns
import matplotlib.pyplot as plt

# 加载数据
data = pd.read_excel('data.xlsx', sheet_name='Sheet1')

# 数据清洗
data.drop_duplicates(inplace=True)
X = data.drop(columns=['机器编号', '是否发生故障', '具体故障类别'])
y = data['是否发生故障']

# 划分训练集和测试集
X_train, X_test, y_train, y_test = train_test_split(X, y, test_size=0.2, random_state=42)

# 创建并训练模型
xgb_model = XGBClassifier(n_estimators=100, learning_rate=0.1, max_depth=3, random_state=42)
xgb_model.fit(X_train, y_train)

# 预测
y_pred = xgb_model.predict(X_test)
y_pred_proba = xgb_model.predict_proba(X_test)[:, 1]  # 获取正类的概率

# 评估模型
print(classification_report(y_test, y_pred))

# 绘制混淆矩阵
cm = confusion_matrix(y_test, y_pred)
plt.figure(figsize=(8, 6))
sns.heatmap(cm, annot=True, fmt="d", cmap="Blues", cbar=False,
            xticklabels=['No Failure', 'Failure'],
            yticklabels=['No Failure', 'Failure'])
plt.xlabel('Predicted')
plt.ylabel('Actual')
plt.title('Confusion Matrix')
plt.show()

# 计算ROC曲线
fpr, tpr, _ = roc_curve(y_test, y_pred_proba)
roc_auc = roc_auc_score(y_test, y_pred_proba)

# 绘制ROC曲线
plt.figure(figsize=(8, 6))
plt.plot(fpr, tpr, color='darkorange', lw=2, label=f'ROC curve (area = {roc_auc:.2f})')
plt.plot([0, 1], [0, 1], color='navy', lw=2, linestyle='--')
plt.xlim([0.0, 1.0])
plt.ylim([0.0, 1.05])
plt.xlabel('False Positive Rate')
plt.ylabel('True Positive Rate')
plt.title('Receiver Operating Characteristic (ROC)')
plt.legend(loc="lower right")
plt.show()

# 计算PR曲线
precision, recall, _ = precision_recall_curve(y_test, y_pred_proba)
pr_auc = auc(recall, precision)

# 绘制PR曲线
plt.figure(figsize=(8, 6))
plt.plot(recall, precision, color='blue', lw=2, label=f'PR curve (area = {pr_auc:.2f})')
plt.plot([0, 1], [y_test.mean(), y_test.mean()], color='navy', lw=2, linestyle='--')
plt.xlim([0.0, 1.0])
plt.ylim([0.0, 1.05])
plt.xlabel('Recall')
plt.ylabel('Precision')
plt.title('Precision-Recall Curve')
plt.legend(loc="lower left")
plt.show()
3.3 结果分析
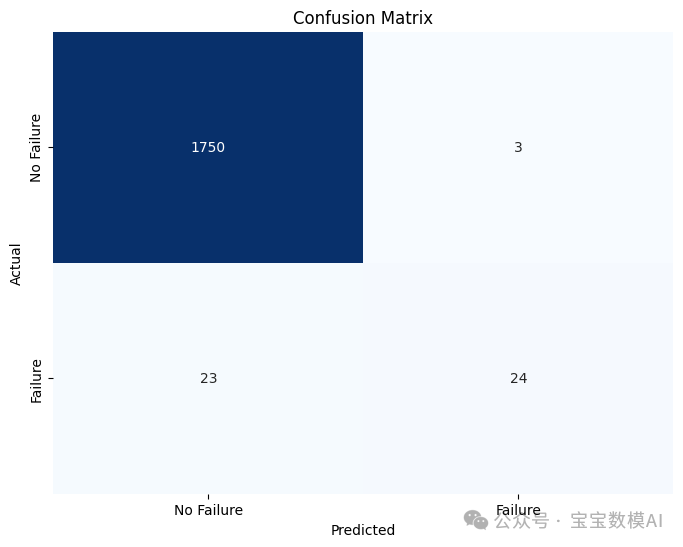
通过上述代码,我们得到了模型在测试集上的性能报告,其中包括精确度(Precision)、召回率(Recall)以及F1分数(F1-score)。
precision    recall  f1-score   support

           0       0.99      1.00      0.99      1753
           1       0.89      0.51      0.65        47

    accuracy                           0.99      1800
   macro avg       0.94      0.75      0.82      1800
weighted avg 0.98 0.99 0.98 1800- 准确率 (Accuracy):表示模型正确预测的比例。
- 精确度 (Precision):表示被模型预测为正类的样本中实际为正类的比例。
- 召回率 (Recall):表示所有实际为正类的样本中,被模型正确识别出来的比例。
- F1分数 (F1-score):是精确度和召回率的调和平均数,用于综合评价模型的性能。
混淆矩阵展示了模型在不同类别上的预测结果,帮助我们理解哪些类别容易被误判。

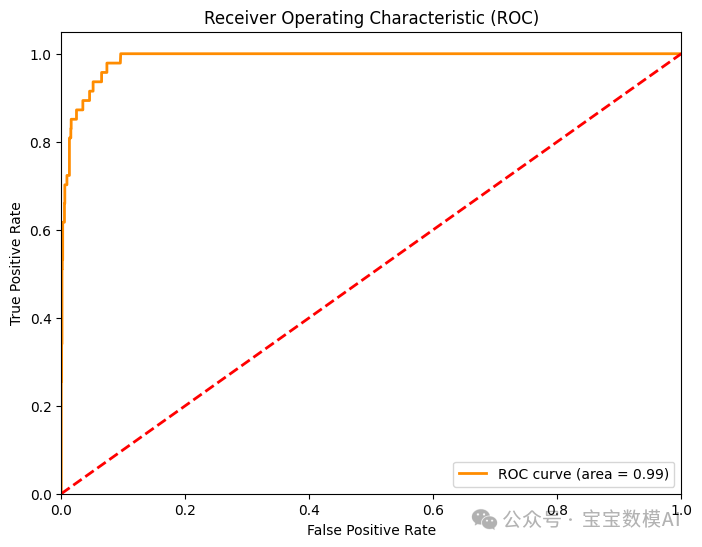
ROC曲线显示了模型在不同阈值下的表现,AUC(Area Under the Curve)值反映了模型的整体区分能力。一个接近1.0的AUC值表明模型具有很好的区分能力。

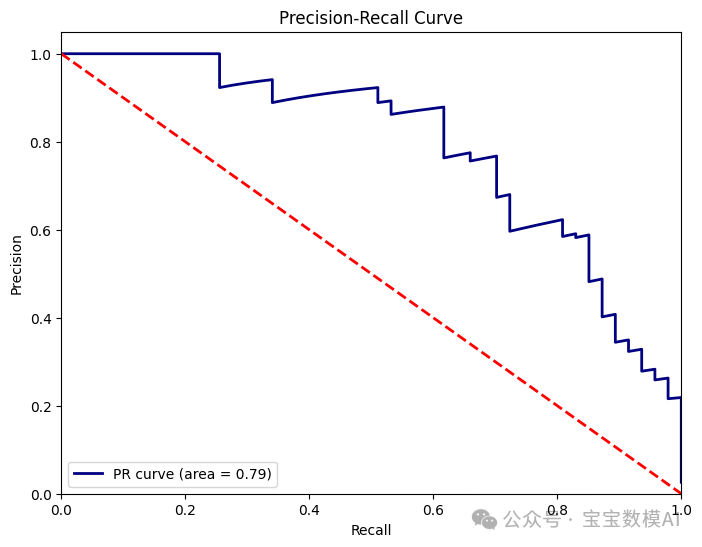
PR曲线显示了模型在不同召回率下的精确度,PRAUC(Area Under the Precision-Recall Curve)值反映了模型在不同召回率下的平均精确度。对于不平衡数据集,PR曲线通常比ROC曲线更能反映模型的性能。

四、结语
通过本文的介绍,我们深入了解了XGBoost算法的基本概念、工作原理以及如何在实际数据集上应用该算法。XGBoost以其高效性和强大的预测能力,在许多机器学习任务中表现出色,特别是在处理不平衡数据集时。通过案例分析,我们不仅评估了模型的性能,还通过可视化工具如混淆矩阵、ROC曲线和PR曲线来更直观地理解模型的表现。
本文转载自宝宝数模AI,作者: BBSM


